 [01]
[01]Discovery
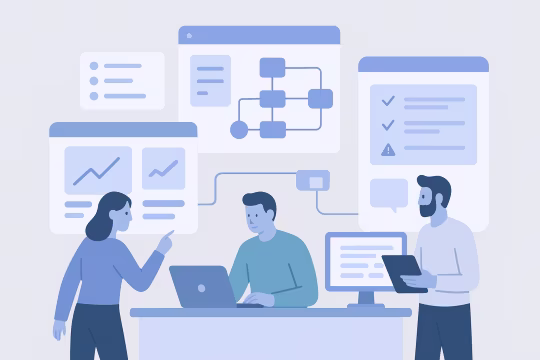
We review current reporting processes, stakeholders, source systems, and recurring analytical outputs. This establishes where manual effort is concentrated and which reporting use cases are suitable for structured automation.
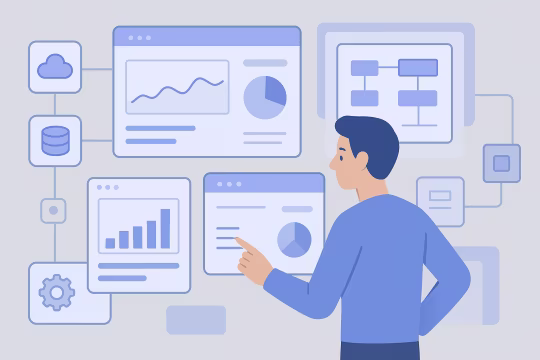
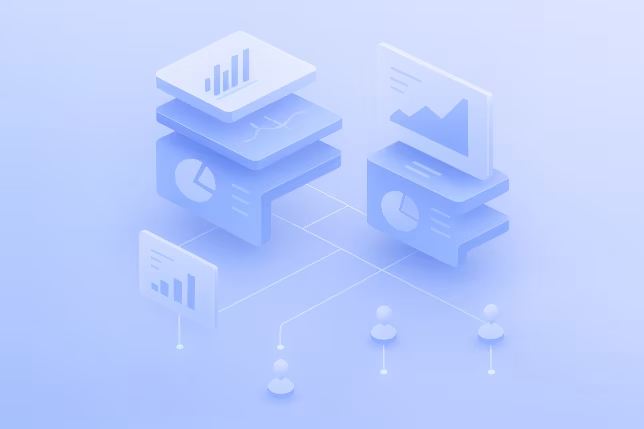
AI-assisted reporting and insight automation applies language models, workflow orchestration, analytics pipelines, and business intelligence systems to reduce manual reporting effort and improve the consistency of analytical outputs. It is typically used where teams need to transform large volumes of customer, content, or operational data into summaries, alerts, recurring reports, and decision-ready narratives.
As reporting environments expand, organizations often accumulate disconnected dashboards, duplicated metrics, and inconsistent interpretation across departments. Automated insight workflows help standardize how data is collected, interpreted, and distributed while preserving governance, traceability, and human review where required. This is especially relevant for executive reporting, product analytics, marketing operations, and customer intelligence functions.
Within a broader platform architecture, this capability supports scalable decision support by connecting data sources, semantic definitions, reporting logic, and AI summarization layers. The result is a more structured operating model for analytics delivery, where reporting becomes a managed system rather than a set of manual tasks repeated across teams.
Core Focus
Best Fit For
Key Outcomes
Technology Ecosystem
Delivery Scope
As analytics estates grow, reporting often becomes a fragmented operational process rather than a coherent platform capability. Different teams maintain separate dashboards, export data into spreadsheets, rewrite similar summaries for different audiences, and interpret the same metrics in inconsistent ways. Over time, reporting logic becomes difficult to trace, definitions drift across departments, and insight delivery depends heavily on a small number of analysts or operations specialists.
This creates architectural and operational strain. Engineering teams must support multiple reporting tools, duplicated data transformations, and ad hoc integrations that were never designed as reusable systems. Product, marketing, and leadership stakeholders receive outputs in different formats and at different levels of quality, which makes comparison and prioritization harder. In many cases, dashboards exist, but the work required to convert them into actionable reporting remains manual, repetitive, and difficult to scale.
The result is slower decision cycles, higher reporting overhead, and increased risk of inconsistency in executive communication. Teams spend time assembling updates instead of improving instrumentation, data quality, or analytical models. Without a structured automation layer, reporting remains dependent on individual effort, and the platform cannot reliably support growing demand for timely, governed, and context-aware insight delivery.
Assess reporting audiences, decision cycles, current dashboards, data sources, and manual workflows. This stage identifies where repetitive reporting effort exists, which outputs require governance, and where AI-assisted summarization can be introduced safely.
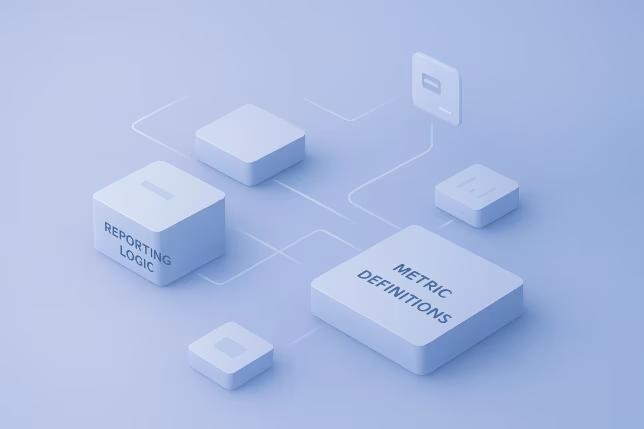
Establish shared metric definitions, reporting semantics, and source-of-truth rules across teams. This reduces ambiguity before automation is introduced and ensures generated insights are based on stable analytical logic rather than inconsistent local interpretations.
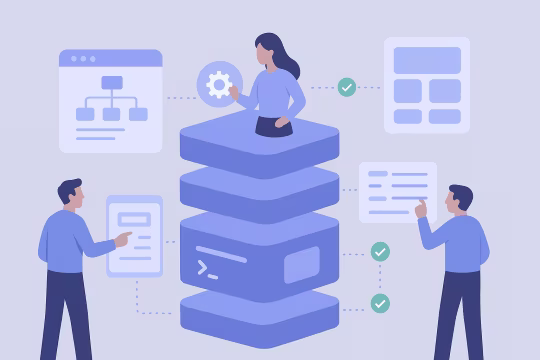
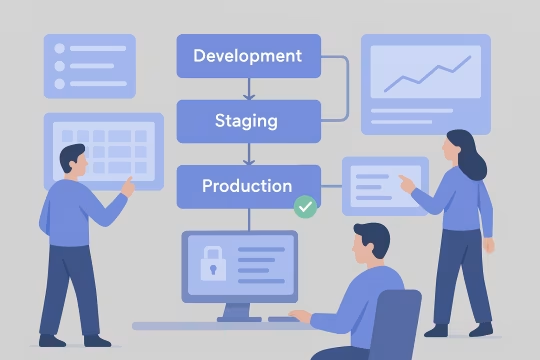
Design the reporting pipeline across data sources, orchestration layers, BI tools, prompt logic, review controls, and delivery channels. The architecture defines how data moves into summaries, who validates outputs, and where auditability is required.
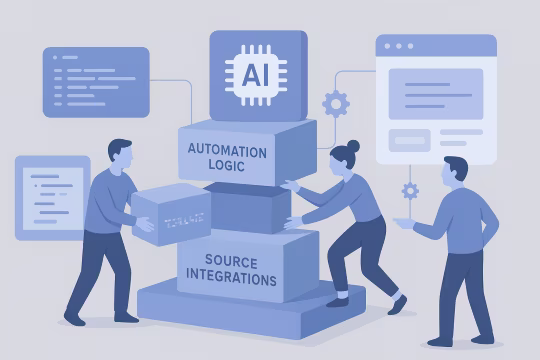
Implement connectors to analytics pipelines, CDPs, dashboards, reporting systems, and communication channels. Integration work focuses on reliable data access, structured payloads, and repeatable execution across scheduled and event-driven workflows.
Develop prompt patterns, summarization templates, threshold logic, and contextual rules for different reporting audiences. This stage translates analytical outputs into structured narratives, alerts, and recurring summaries with controlled variability.
Test data accuracy, summary quality, edge cases, exception handling, and approval flows. Validation covers both technical correctness and reporting usefulness, ensuring automated outputs remain aligned with governance and operational expectations.
Deploy workflows into production with scheduling, monitoring, access control, and fallback procedures. Rollout planning includes ownership models, escalation paths, and documentation so reporting automation can operate as a managed platform capability.
Refine prompts, thresholds, source mappings, and delivery logic based on usage patterns and stakeholder feedback. Ongoing tuning helps maintain relevance as metrics evolve, new data sources are added, and reporting needs change over time.
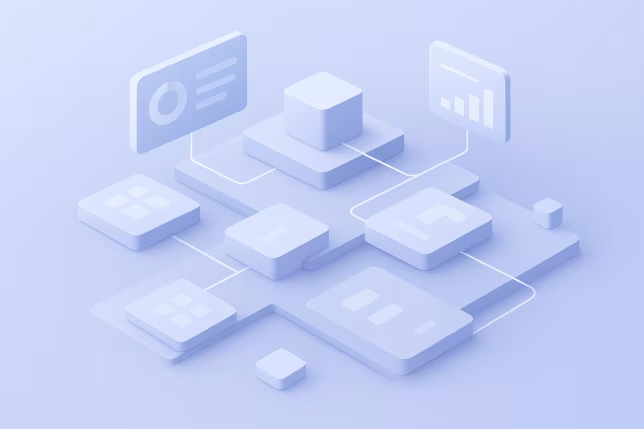
This capability combines analytics engineering, workflow orchestration, and AI-assisted interpretation into a structured reporting layer. It is designed to support repeatable insight generation across dashboards, customer data systems, and operational reporting processes. The emphasis is on governed automation, reusable reporting logic, and maintainable integration patterns that scale across teams. Rather than replacing analytical judgment, it creates a framework for producing consistent, traceable, and context-aware outputs from complex data environments.

Reporting workflows are designed as structured systems rather than isolated automations. This includes orchestration logic, source mapping, execution schedules, delivery channels, and review checkpoints. A clear architecture makes reporting repeatable, observable, and easier to extend as new audiences, metrics, and data products are introduced.

Language models are applied to transform analytical outputs into structured summaries, narratives, alerts, and commentary. The implementation uses controlled prompts, contextual inputs, and formatting rules to reduce inconsistency. This enables teams to generate recurring reporting outputs without relying on manual rewriting for every reporting cycle.

Automated insights depend on explicit logic for trend detection, threshold evaluation, anomaly context, and comparative analysis. This capability defines how raw metrics are interpreted before they are summarized. By separating interpretation rules from presentation, organizations can maintain consistency across dashboards, reports, and downstream decision workflows.

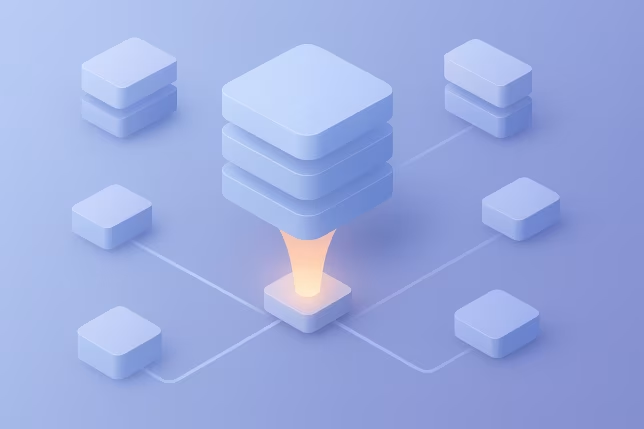
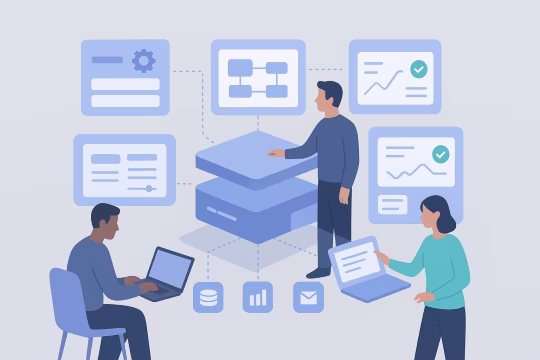
The service connects BI platforms, customer data systems, analytics pipelines, and operational data sources into a unified reporting process. Integration patterns are designed for reliability, schema clarity, and controlled access. This reduces manual extraction work and supports a more dependable flow of data into automated reporting layers.
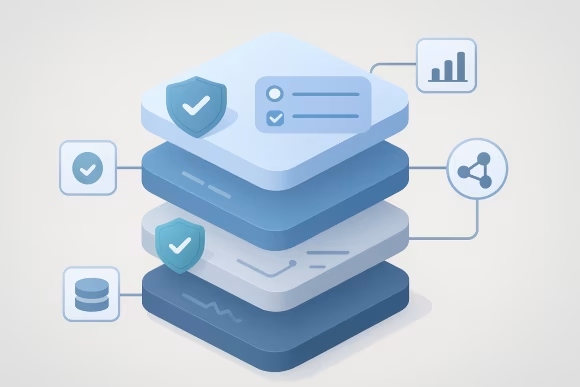
Automated reporting requires controls for approval, traceability, access, and exception handling. Governance capabilities define where human review is required, how outputs are versioned, and how generated content is linked back to source metrics. This is essential for executive reporting, regulated environments, and cross-functional analytics operations.

Prompt logic is treated as reusable reporting infrastructure rather than ad hoc text generation. Templates, variable structures, audience-specific instructions, and output constraints are standardized so workflows can be maintained over time. This improves consistency across reporting use cases and reduces drift as automation expands.

Insight automation workflows need monitoring for execution failures, stale data, low-confidence outputs, and delivery issues. Observability is built into the reporting layer so teams can detect when pipelines, prompts, or source systems are affecting output quality. This supports reliable long-term operation rather than one-off automation.

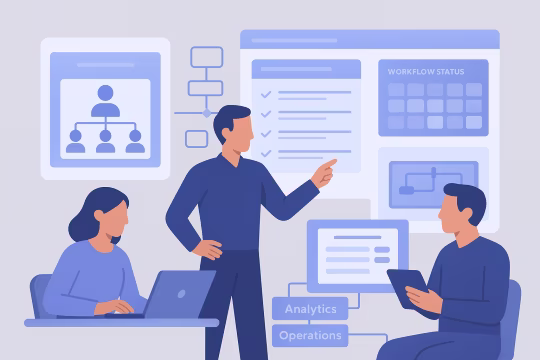
Different stakeholders require different reporting depth, terminology, and cadence. This capability supports tailored outputs for executives, product teams, marketing operations, and analytics leadership while preserving shared metric foundations. It allows one reporting architecture to serve multiple decision contexts without duplicating the underlying workflow.
Delivery is structured as an engineering engagement that moves from reporting analysis into architecture, implementation, validation, and operational tuning. The model is designed for enterprise environments where data quality, governance, and cross-team adoption matter as much as automation speed.
[01]We review current reporting processes, stakeholders, source systems, and recurring analytical outputs. This establishes where manual effort is concentrated and which reporting use cases are suitable for structured automation.
 [02]
[02]We define the target workflow architecture, including data inputs, orchestration, prompt layers, review controls, and delivery channels. The architecture is designed to support reliability, traceability, and future extension across teams.
 [03]
[03]We build the reporting workflows, source integrations, templates, and automation logic required for recurring insight generation. Implementation focuses on maintainable components rather than isolated scripts or one-off dashboard add-ons.
 [04]
[04]We validate source accuracy, output quality, exception handling, and governance rules before production rollout. Testing includes both technical verification and stakeholder review of reporting usefulness and clarity.
 [05]
[05]We deploy workflows with scheduling, monitoring, access controls, and operational documentation. Production rollout is planned to fit existing analytics and platform operating models rather than bypass them.
 [06]
[06]We support internal teams with documentation, ownership models, and workflow management guidance. This helps analytics, operations, and platform teams maintain and evolve the reporting layer after launch.
 [07]
[07]We refine prompts, thresholds, templates, and delivery logic based on usage data and stakeholder feedback. Optimization ensures the reporting system remains relevant as metrics, audiences, and data sources change.
When reporting and insight generation are engineered as a platform capability, organizations reduce manual overhead and improve the consistency of decision support. The impact is typically seen in reporting speed, governance, operational clarity, and the ability to scale analytics outputs across more teams without proportional increases in effort.
Recurring reports can be assembled and distributed with far less manual intervention. Teams spend less time compiling updates and more time investigating changes, improving instrumentation, and supporting decisions with deeper analysis.
Analysts and operations teams no longer need to repeat the same extraction, formatting, and summary tasks across reporting periods. This reduces repetitive work and creates capacity for higher-value analytical and platform activities.
Shared metric definitions, structured prompts, and reusable templates reduce variation in how performance is described across teams. Decision-makers receive outputs that are easier to compare and more reliable over time.
Approval controls, source traceability, and defined review points make automated reporting safer to use in enterprise settings. This is particularly important where executive communication, compliance, or cross-functional accountability are involved.
A single reporting architecture can serve multiple audiences, channels, and reporting cadences. This allows organizations to expand insight delivery without rebuilding the process for every department or stakeholder group.
Monitoring, fallback logic, and managed workflows reduce the operational fragility common in spreadsheet-based or analyst-dependent reporting processes. Reporting becomes less dependent on individual knowledge and more resilient as teams change.
Reporting automation encourages clearer integration between analytics pipelines, dashboards, customer data systems, and operational workflows. This improves architectural coherence and reduces the fragmentation that often develops in mature analytics estates.
This service commonly connects with adjacent platform, data, and customer intelligence capabilities such as analytics architecture, customer data integration, orchestration, and reporting operations.
AI-assisted analysis for customer data ecosystems
Customer analytics platform implementation for governed metrics and behavioral analytics
Unified customer profile architecture and insight-ready datasets
CDP event pipeline architecture and identity foundations
Unified customer profile design across identities and events
Customer profile and event schema engineering
Stewardship, standards, and CDP data policy and controls
CDP monitoring and data reliability for customer data
Consistent experiment tracking, metrics, and attribution
CDP audience activation with governed delivery to channels
Event-driven journeys across channels and products
Governed automation across content and operations
These questions address architecture, operations, integration, governance, risk, and engagement considerations for AI-assisted reporting and insight automation in enterprise environments.
AI reporting automation usually sits between existing analytics systems and the channels where reporting is consumed. It does not replace data warehouses, BI tools, CDPs, or dashboard platforms. Instead, it adds a structured orchestration and interpretation layer that can read approved metrics, apply reporting logic, generate summaries, and distribute outputs to the right audiences. In a well-designed architecture, the reporting layer depends on governed source systems and shared metric definitions. Data pipelines still handle collection and transformation, semantic models still define business meaning, and BI tools still provide exploration and visualization. The automation layer uses those foundations to produce recurring narratives, alerts, and decision-ready summaries. This separation is important because it prevents language models from becoming an uncontrolled source of analytical truth. For enterprise teams, the architectural goal is to make reporting automation observable, testable, and maintainable. That means clear source mappings, versioned prompt logic, execution monitoring, approval checkpoints where needed, and documented ownership. When implemented this way, AI-assisted reporting becomes a platform capability that extends existing analytics investments rather than creating another disconnected reporting tool.
The most important prerequisite is a stable analytical foundation. Organizations should have reasonably clear metric definitions, identifiable source systems, and enough confidence in data quality to support recurring reporting. If dashboards are inconsistent, semantic definitions vary by team, or core data pipelines are unreliable, automation will amplify those weaknesses rather than solve them. A second requirement is a defined reporting model. Teams need to know which audiences receive which outputs, how often reports are generated, what level of interpretation is acceptable, and where human review is required. Without that structure, automation tends to produce outputs that are technically possible but operationally difficult to trust or adopt. It is also useful to have basic governance and observability in place. This includes access controls, auditability for source data, and monitoring for workflow failures or stale inputs. None of these foundations need to be perfect before starting, but they should be explicit enough to support controlled implementation. In many engagements, part of the work is identifying where those foundations are weak and designing the automation layer so it can evolve alongside improvements in the broader analytics platform.
The best candidates are recurring reporting tasks that follow a recognizable structure and rely on stable data inputs. Examples include weekly executive summaries, campaign performance updates, product KPI digests, customer behavior reports, anomaly alerts, and operational dashboard commentary. These processes often consume significant analyst time because the same metrics are reviewed repeatedly and translated into similar narrative formats. Good candidates also have a clear audience and a known decision context. If a report exists to support a regular business review, operational checkpoint, or leadership update, it is easier to define the required output structure and validation rules. Automation works well when the reporting objective is understood and the workflow can be standardized without removing necessary judgment. Poor candidates are usually highly exploratory analyses, one-off investigations, or situations where the underlying data is still unstable. In those cases, the primary need is often better instrumentation, modeling, or analytical framing rather than automation. A practical operating model often starts with a small number of high-volume, repeatable reporting workflows and expands once teams trust the process and governance model.
Long-term operation requires the same discipline as other production platform capabilities. Workflows need owners, monitoring, documentation, and a process for updating source mappings, prompt logic, thresholds, and delivery rules. If reporting automation is treated as a side script maintained informally, it becomes fragile very quickly as dashboards, schemas, and stakeholder expectations change. A mature operating model usually includes scheduled reviews of output quality, alerting for failed runs or stale data, and version control for templates and prompt configurations. Teams also need a way to handle exceptions, such as missing source data, unusual metric behavior, or reporting periods that require additional context. In some environments, outputs are fully automated; in others, they pass through an approval step before distribution. Maintenance is often shared across analytics engineering, platform teams, and reporting stakeholders. The exact model depends on the organization, but the key principle is that automation should be managed as a supported service. This keeps reporting reliable, reduces drift in generated outputs, and ensures the system remains aligned with evolving business definitions and platform architecture.
Yes, in most cases the automation layer is designed specifically to work with existing analytics infrastructure rather than replace it. Common integrations include BI platforms, dashboard APIs, customer data platforms, data warehouses, event pipelines, reporting databases, and communication channels such as email, chat, or internal portals. The exact integration pattern depends on how data is exposed and how reporting outputs need to be delivered. The most effective implementations use governed interfaces wherever possible. That may mean reading from semantic layers, approved reporting tables, or curated dashboard endpoints instead of pulling directly from raw operational systems. This reduces ambiguity and helps ensure that automated summaries reflect the same definitions already used by analytics and business teams. Integration design also needs to account for execution reliability, access control, and schema stability. Reporting workflows should know what to do when a source is delayed, when an expected field changes, or when a dashboard metric is no longer available. With the right integration architecture, AI-assisted reporting can sit cleanly on top of existing systems and extend their usefulness without creating unnecessary duplication.
Multi-domain reporting requires a clear separation between source data, interpretation logic, and audience-specific presentation. Customer data, product analytics, content performance, and operational metrics often come from different systems and are maintained by different teams. Trying to automate all of that through one generic workflow usually creates confusion. A better approach is to define domain-specific inputs and then apply shared orchestration patterns across them. Audience handling is equally important. Executives, product owners, marketing operations, and analytics leadership often need different levels of detail, terminology, and reporting cadence. The underlying metrics may overlap, but the output format should reflect the decision context. This is typically managed through reusable templates, prompt variables, and delivery rules that preserve a common metric foundation while adapting the narrative structure. From an engineering perspective, the goal is to avoid duplicating the entire workflow for every audience. Instead, the architecture should support modular inputs, reusable interpretation components, and controlled output variants. That makes the reporting system easier to maintain as new domains and stakeholder groups are added.
Governance starts with source control and traceability. Every automated output should be linked to approved data sources, known metric definitions, and versioned reporting logic. Teams need to know where the numbers came from, how they were interpreted, and which prompt or template configuration was used to generate the final summary. Without that visibility, trust in the reporting layer declines quickly. Access control is also essential. Not every user should be able to change prompts, alter thresholds, or publish generated outputs to broad audiences. In many enterprise settings, there are separate permissions for workflow configuration, data access, review, and final distribution. This helps prevent accidental changes and supports accountability across analytics, platform, and business teams. A third control area is review policy. Some reports can be fully automated, while others require human approval before release. Governance should define which outputs need review, what exceptions trigger escalation, and how updates are documented over time. These controls do not need to make the system slow, but they do need to make it reliable, explainable, and appropriate for the reporting context.
Consistency depends on treating reporting logic as a managed asset rather than embedding assumptions in hidden scripts or prompts. Metric definitions, threshold rules, comparative periods, and interpretation patterns should be documented and versioned. When business definitions change, those updates should flow through a controlled process so the reporting layer stays aligned with the broader analytics model. Reusable templates and modular prompt structures also help. Instead of writing each report independently, teams can maintain shared logic for common patterns such as trend summaries, anomaly explanations, or audience-specific formatting. This reduces drift and makes it easier to update many reporting outputs when a metric, taxonomy, or business rule changes. Regular review is still necessary. Even with strong structure, reporting systems can degrade if source schemas shift, dashboards are redesigned, or stakeholders begin using outputs in new ways. A governance model that includes scheduled audits, ownership, and change management keeps the automation layer aligned with the platform over time. The objective is not static reporting, but controlled evolution without losing consistency or traceability.
The main risks are usually inaccurate source data, inconsistent metric interpretation, overconfident generated language, and weak operational controls. If the underlying data is wrong or ambiguous, automated summaries can spread that problem faster than manual reporting. Similarly, if prompts are poorly constrained, generated commentary may sound plausible while overstating what the data actually shows. Mitigation starts with architecture. Use approved data sources, explicit interpretation rules, and structured templates rather than open-ended generation. Add validation checks for missing data, unexpected values, and stale inputs. Where reporting is sensitive or high-impact, include human review before distribution. Monitoring should also detect workflow failures, schema changes, and unusual output patterns so issues are visible early. Another important mitigation is scope discipline. Not every reporting use case should be automated immediately. Starting with repeatable, lower-risk workflows allows teams to establish controls, build trust, and learn where the boundaries should be. Over time, the system can expand, but only if governance, observability, and ownership mature alongside the automation capability.
In a well-designed model, automation should reduce repetitive reporting effort without removing analytical judgment where it matters. The goal is not to replace analysts or product thinkers, but to remove the manual assembly work that consumes time and creates inconsistency. Analysts still play a critical role in defining metrics, validating interpretations, investigating anomalies, and deciding how insights should influence action. Analytical quality often improves when repetitive reporting is standardized. Shared templates, explicit logic, and governed source mappings can reduce the variation that appears when different people summarize the same dashboard in different ways. At the same time, teams should be careful not to automate interpretive tasks that still require domain expertise, especially in ambiguous or high-stakes contexts. A practical model is to automate the repeatable layers of reporting and keep humans responsible for oversight, exception handling, and deeper analysis. This creates a better division of labor. Automation handles consistency and scale, while people focus on context, prioritization, and decisions that cannot be reduced to a reporting template.
A typical engagement begins with assessment and design. This includes reviewing current reporting workflows, identifying manual bottlenecks, mapping source systems, clarifying audiences, and defining where AI-assisted summarization is appropriate. The output of this phase is usually a target architecture, a prioritized set of use cases, and a governance model for rollout. Implementation then focuses on a limited number of high-value workflows. Teams build integrations to BI tools, CDPs, analytics pipelines, or reporting databases; define prompt and template structures; establish review controls; and validate output quality with stakeholders. This phase is usually iterative because reporting usefulness depends on both technical correctness and audience fit. Later stages often include operationalization and enablement. That means production deployment, monitoring, documentation, ownership handoff, and refinement based on usage. Some organizations need a focused implementation for one reporting domain, while others use the engagement to establish a broader reporting automation framework that can be extended across multiple teams over time.
Collaboration usually begins with a working session focused on the current reporting landscape. We review existing dashboards, recurring reports, source systems, stakeholder groups, and the manual steps involved in producing insight outputs today. The purpose is to understand where reporting effort is concentrated, where inconsistencies appear, and which workflows are strong candidates for automation. From there, we define an initial scope that is narrow enough to validate quickly but meaningful enough to demonstrate operational value. This often includes one or two reporting workflows, the relevant source integrations, governance requirements, and the target delivery channels. We also identify dependencies such as metric definition gaps, data quality concerns, or ownership questions that need to be addressed early. The first delivery phase is typically architectural and practical rather than promotional. It focuses on mapping the workflow, designing controls, and implementing a pilot that can be tested with real stakeholders. That approach helps teams evaluate fit, trust, and maintainability before expanding the capability across a wider analytics or platform environment.
These case studies show how analytics instrumentation, customer data integration, dashboards, and reporting layers were implemented in real delivery environments. They are especially relevant for teams evaluating AI-assisted reporting because they demonstrate the underlying data pipelines, governance, and measurement foundations needed for reliable automated summaries and decision-ready insights. Together, they provide concrete proof of how reporting ecosystems can be standardized across platforms, audiences, and business workflows.
Organogenesis faced operational challenges managing multiple brand websites on outdated platforms, resulting in fragmented workflows, high maintenance costs, and limited scalability across a multi-brand digital presence.
The transformation reduced time-to-deliver marketing updates by 20–25%, improved Lighthouse scores to ~90+, and delivered a scalable multi-brand foundation for long-term growth.
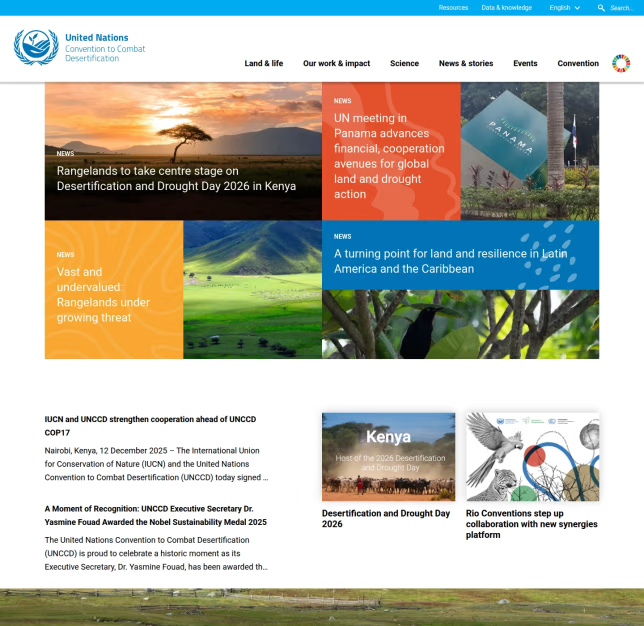
UNCCD operated four separate websites (two WordPress, two Drupal), leading to inconsistencies in design, content management, and user experience. A unified, scalable solution was needed to support a large-scale CMS migration project and improve efficiency and usability.
The modernization effort resulted in a cohesive, user-friendly, and scalable website, improving content management efficiency and long-term digital sustainability.
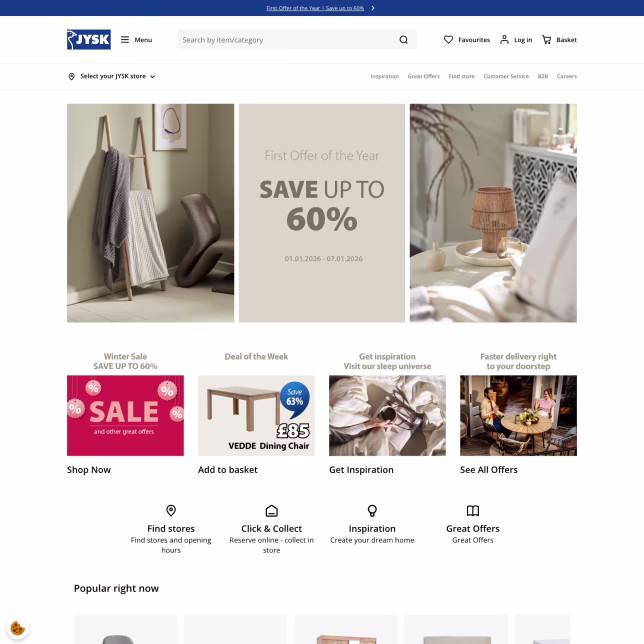
JYSK required a robust retail Digital Experience Platform (DXP) integrated with a Customer Data Platform (CDP) to enable data-driven design decisions, enhance user engagement, and streamline content updates across more than 25 local markets.
The modernized platform empowered JYSK’s marketing and content teams with real-time insights and modern workflows, leading to stronger engagement, higher conversions, and a scalable global platform.
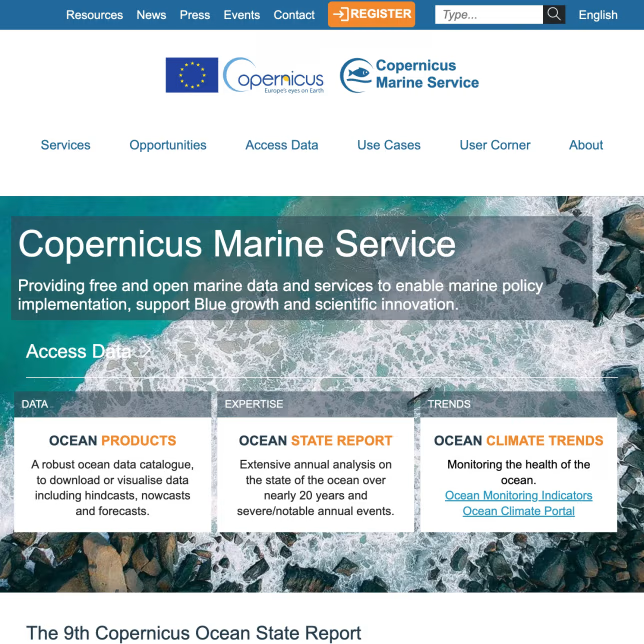
The existing marine data portal relied on three unaligned WordPress installations and embedded PHP code, creating inefficiencies and risks in content management and usability.
The new Drupal DXP streamlined content operations and improved accessibility, offering scientists and businesses a more efficient gateway to marine data services.
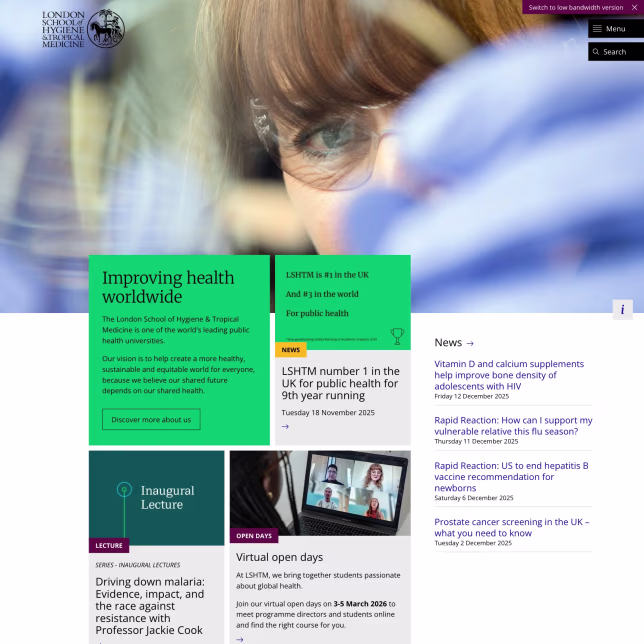
LSHTM required improvements to its existing higher education Drupal platform to better manage and distribute complex research data, including support for third-party integrations, Drupal performance optimization, and more reliable synchronization.
The solution improved data accessibility, streamlined research workflows, and enhanced system performance, enabling LSHTM to manage complex datasets more efficiently.
Oleksiy (PathToProject) has been a valuable developer resource over the past six months for us at LSHTM. This included coming on board to revive and complete a stalled Drupal upgrade project, as well as carrying out work to improve our site accessibility and functionality.
I have found Oleksiy to be very knowledgeable and skilful and would happily work with him again in the future.

Ali Kazemi
Web & Digital Manager at London School of Hygiene & Tropical Medicine
It was my pleasure working with Oleksiy (PathToProject) on a new Drupal website. He is a true full-stack developer—the ideal mix of DevOps expertise, deep front-end knowledge, and the structured thinking of a senior back-end developer.
He is well-organized and never lets anything slip. Oleksiy understands what needs to be done before being asked and can manage a project independently with minimal involvement from clients, product managers, or business analysts.
One of the best consultants I’ve worked with so far.

Andrei Melis
Technical Lead at Eau de Web
Oleksiy (PathToProject) worked with me on a specific project over a period of three months. He took full ownership of the project and successfully led it to completion with minimal initial information.
His technical skills are unquestionably top-tier, and working with him was a pleasure. I would gladly collaborate with Oleksiy again at any opportunity.

Nikolaj Stockholm Nielsen
Strategic Hands-On CTO | E-Commerce Growth
These articles cover the data contracts, identity rules, consent controls, and operating-model decisions that make automated reporting and insight workflows reliable at scale. They are useful background for teams designing AI-assisted summaries, dashboard automation, and governed analytics delivery across CDP and BI environments.
Let’s review your reporting workflows, data sources, and governance model to define a practical path toward scalable insight automation.