


 [01]
[01]Discovery and Baseline
Map the WordPress topology, dependencies, and current monitoring coverage. Establish a baseline for availability, latency, and error rates, and identify the highest-risk operational gaps affecting on-call response.
WordPress infrastructure visibility
Assess metrics, logs, dashboards, and alerting gaps across your WordPress runtime and infrastructure.
Ideal for teams dealing with noisy alerts, blind spots, or slow incident triage.
No login required. Takes 2–3 minutes.
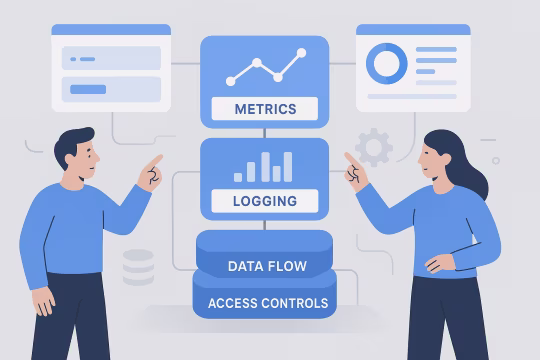
WordPress monitoring and observability establishes the telemetry needed to operate a production platform with predictable reliability. As part of WordPress monitoring services, it combines metrics, logs, and alerting into a coherent model so teams can detect regressions early, diagnose incidents quickly, and understand how infrastructure and application behavior interact under load.
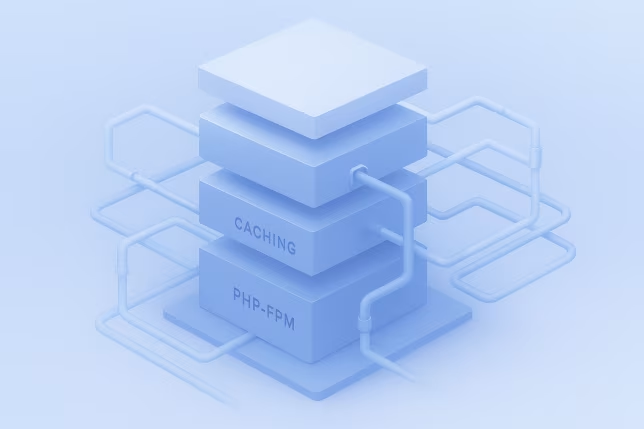
As WordPress estates grow, operational signals often fragment across hosting dashboards, plugin-level indicators, and ad hoc log access. This makes it difficult to answer basic questions such as which requests are failing, whether PHP-FPM saturation is causing latency, or which background jobs are backing up. WordPress observability engineering provides consistent instrumentation and dashboards across environments, enabling shared operational language between platform, SRE, and product teams.
A well-implemented observability stack supports scalable platform architecture by making performance and reliability measurable. It enables SLI/SLO definitions, WordPress SLI SLO error budget monitoring, alert thresholds aligned to user impact, and capacity planning based on evidence rather than assumptions. The result is an operational foundation that reduces risk during releases, supports incident response, and improves long-term maintainability of the WordPress runtime and its dependencies.
Core Focus
Best Fit For
Key Outcomes
Technology Ecosystem
Platform Integrations
As WordPress platforms evolve, operational visibility often lags behind architectural complexity. Teams may rely on host-level graphs, sporadic plugin metrics, and manual log access that varies by environment. When traffic patterns change, new integrations are introduced, or caching layers are adjusted, the platform can exhibit latency spikes or intermittent errors without a clear signal of where the bottleneck originates.
This lack of consistent telemetry impacts both engineering and operations. Without standardized metrics and structured logs, it is difficult to correlate PHP-FPM saturation with upstream timeouts, distinguish application errors from infrastructure constraints, or quantify the impact of a release. Alerting typically becomes either too quiet (missed incidents) or too noisy (alert fatigue), and teams lose confidence in operational signals. Over time, dashboards become a collection of disconnected charts rather than a model of system behavior.
Operationally, the consequences show up as longer incident calls, repeated “unknown cause” postmortems, and reactive scaling decisions. Release risk increases because regressions are detected late and are hard to attribute. Platform teams also struggle to define reliability targets, since there is no shared baseline for availability, latency, and error rates across the WordPress request lifecycle.
Review the WordPress runtime, hosting topology, caching layers, and critical user journeys. Identify current monitoring gaps, incident patterns, and the signals required to support on-call response and capacity planning.
Define the metrics, logs, and traces strategy appropriate for WordPress and its dependencies. Establish naming conventions, label cardinality rules, and a consistent approach to service boundaries, SLIs, and alert conditions.
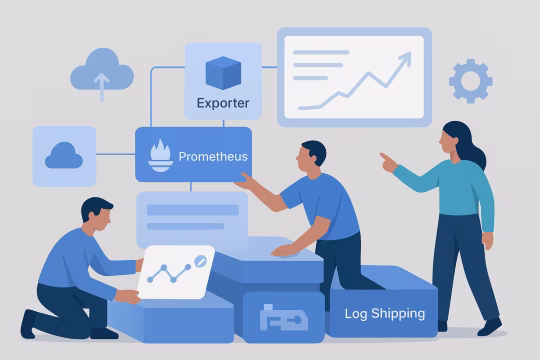
Implement collection for infrastructure and application-adjacent metrics, including web tier, PHP-FPM, database, cache, and queue signals where applicable. Configure Prometheus scraping, exporters, and recording rules to support stable dashboards and alerts.
Centralize logs from containers and services into an indexed store with retention and access controls. Normalize formats, add correlation fields, and define parsing rules so teams can pivot from alerts to relevant log context quickly.
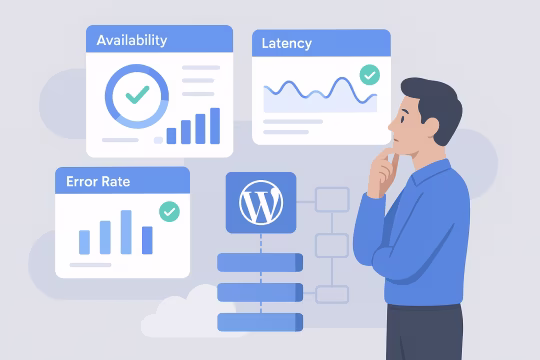
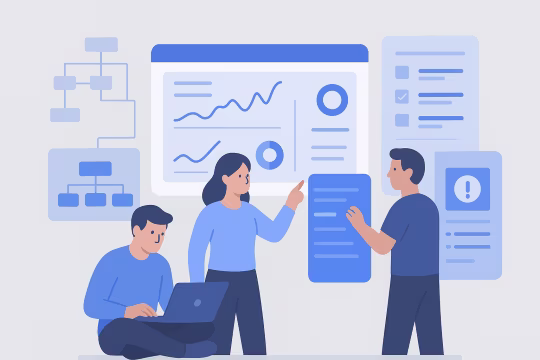
Build Grafana dashboards aligned to operational questions: availability, latency, saturation, and error rates. Define SLIs and SLO targets, add burn-rate views, and annotate releases to support regression detection.
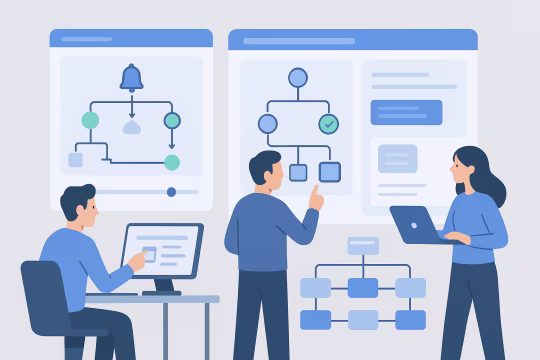
Create alert rules that prioritize user impact and reduce noise through grouping and inhibition. Integrate routing with on-call workflows and define escalation paths, runbook links, and ownership boundaries.
Document incident playbooks and troubleshooting paths tied to dashboards and alerts. Establish post-incident review inputs, including what signals were missing and what instrumentation changes are required.
Iterate on thresholds, dashboards, and retention based on real incidents and platform changes. Track alert quality, SLO compliance, and telemetry costs to keep observability sustainable as the estate grows.
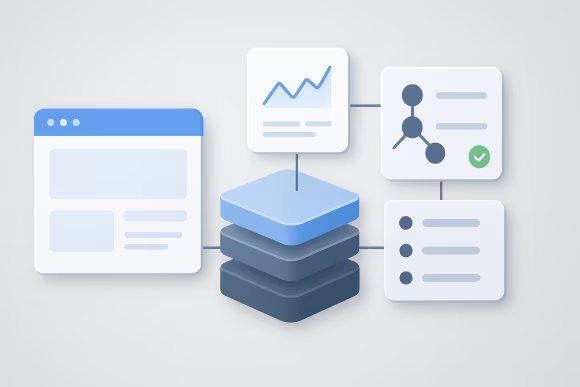
This service establishes an operational telemetry foundation for WordPress that is consistent across environments and teams. The focus is on measurable reliability through curated metrics, structured logs, and alerting tied to user impact. Capabilities include signal modeling, Prometheus and Grafana monitoring for WordPress, dashboard design aligned to incident response, and governance to keep telemetry maintainable as the platform evolves. The result is an observability layer that supports day-to-day operations and long-term platform engineering decisions.

A defined model for what to measure and how to name it across WordPress, infrastructure, and dependencies. This includes metric naming conventions, label cardinality controls, and a consistent mapping from platform components to operational signals so dashboards and alerts remain stable over time.
Prometheus and Grafana monitoring for WordPress starts with metrics collection and aggregation designed for operational use, including exporters and scrape configuration for web tier, PHP-FPM, database, cache, and container runtime. Recording rules and aggregation strategies are applied to reduce query cost and produce reliable SLI calculations.
Dashboards built around incident-response questions rather than raw charts: error rate, latency distribution, saturation, and dependency health. Views are structured to support fast triage, drill-down by environment or site, and release annotations for regression detection.

WordPress log aggregation and ELK stack setup consolidates container and service logs into a searchable store with consistent parsing and retention. Structured fields enable correlation across layers (request, upstream, runtime), making it practical to move from an alert to the relevant log evidence.
SLI definitions for availability and latency, paired with SLO targets and burn-rate alerting to detect user-impacting degradation early. This supports WordPress SLI SLO error budget monitoring, with alert rules tuned to reduce noise and include context such as affected components, runbook links, and ownership routing.
Mechanisms to correlate telemetry with deployments and configuration changes, including annotations and event streams. This supports faster root-cause analysis by linking shifts in error rates or latency to specific releases, infrastructure changes, or dependency incidents.
Controls that keep observability maintainable: retention policies, access boundaries, dashboard ownership, and review cycles for alert quality. Governance reduces drift and prevents uncontrolled metric cardinality, duplicated dashboards, and inconsistent operational definitions.
Review how telemetry, alerting, and dashboards support WordPress reliability before the next outage.
Delivery follows a clear engineering sequence from discovery and baselining through implementation, validation, and ongoing tuning. The work is organized to establish reliable signals first (metrics and logs), then operationalize them with dashboards, SLI/SLO targets, and on-call alerting so enterprise WordPress operations teams can adopt the system incrementally across environments and sites.
[01]Map the WordPress topology, dependencies, and current monitoring coverage. Establish a baseline for availability, latency, and error rates, and identify the highest-risk operational gaps affecting on-call response.
 [02]
[02]Design the metrics and logging architecture, including data flow, retention, access controls, and naming conventions. Define SLIs/SLOs and alerting principles aligned to user impact and operational ownership.
 [03]
[03]Deploy exporters, configure Prometheus scraping, and implement log shipping and parsing. Establish dashboards for core platform health and validate telemetry quality across environments.
 [04]
[04]Create alert rules, routing, and escalation paths with runbook links and ownership boundaries. Tune thresholds and grouping to reduce noise and ensure alerts are actionable during incidents.
 [05]
[05]Run incident simulations and regression checks to validate that dashboards and alerts support fast diagnosis. Adjust instrumentation, queries, and runbooks based on observed gaps and false positives.
 [06]
[06]Provide documentation for dashboards, alert policies, and troubleshooting workflows. Align teams on SLO reporting, review cadence, and how telemetry changes are requested and approved.
 [07]
[07]Iterate based on incident learnings, platform changes, and cost constraints. Maintain alert quality, evolve SLOs, and extend coverage to new sites, services, and integrations as the estate grows.
WordPress monitoring and observability improves operational decision-making by turning platform behavior into measurable signals. It reduces incident duration, improves release confidence, and supports capacity planning with evidence. The impact is strongest when WordPress application performance monitoring and reliability indicators are tied to user-facing SLIs, tracked against SLOs and error budgets, and integrated into on-call workflows.
Centralized telemetry shortens the path from detection to diagnosis by providing consistent dashboards and searchable logs. Teams spend less time gathering evidence and more time applying targeted fixes during incidents.
SLO-based alerting surfaces user-impacting degradation earlier and reduces missed incidents. Clear ownership and runbooks decrease the chance of prolonged outages caused by ambiguous responsibilities.
Alert design focused on SLIs and burn rates reduces false positives and repetitive notifications. This improves on-call sustainability and increases trust in monitoring signals.
Release annotations and regression-focused dashboards make it easier to detect and attribute changes in latency or error rates. Teams can roll back or remediate faster with clearer evidence of impact.
Saturation and throughput metrics support forecasting for PHP workers, database capacity, and cache effectiveness. Scaling decisions become data-driven rather than reactive to peak events.
Defined telemetry standards and review cycles prevent dashboard sprawl and uncontrolled metric growth. This keeps observability maintainable as teams, sites, and integrations expand.
SLIs and SLOs provide a shared language between engineering and product stakeholders. Reliability becomes measurable, enabling prioritization of work based on error budgets and user impact.
WordPress monitoring review
Validate whether your WordPress metrics, logs, and alerts give teams the signals they need to respond faster.
Adjacent services that extend WordPress operational maturity across deployment, performance, and platform governance.
GA4 event tracking WordPress with governed measurement
WordPress REST API engineering and GraphQL API design
WordPress lead contact sync with secure lead capture
WordPress integration services for secure API connections
Custom WordPress REST endpoints, schemas, and authentication patterns
Upgrade-ready architecture, WordPress CI/CD and DevOps, and operational hardening
Caching, delivery tuning, and runtime profiling
Enterprise WordPress hardening and vulnerability management
WordPress CI/CD pipelines and environment standardization
Answers to common questions about how to implement WordPress monitoring and observability, including Prometheus and Grafana monitoring for WordPress, WordPress log aggregation and ELK stack setup, SLI/SLO error budget monitoring, governance, and incident response in enterprise environments.
Uptime alone does not explain user experience or operational risk. For WordPress, you typically want a layered signal model that covers request health, runtime saturation, and dependency behavior. At the application edge, track request rate, error rate (4xx/5xx split), and latency distributions (p50/p95/p99) per site, route group, or upstream. In the runtime, monitor PHP-FPM pool saturation (active/idle workers, queue length), CPU and memory pressure, and container restarts. For data services, include database connections, slow queries, replication lag (if applicable), and cache hit ratio/evictions. You also need signals for background work: cron execution time, queue depth, and failure counts for scheduled tasks that affect publishing, commerce, or integrations. Finally, add change correlation (deploys/config changes) so you can connect telemetry shifts to specific events. The goal is a small set of high-quality signals that explain availability and latency, plus enough supporting telemetry to diagnose the common failure modes in your specific architecture.
SLIs (service level indicators) are the measurements that represent user experience, and SLOs (service level objectives) are the targets you agree to meet. For WordPress, the most practical SLIs are request success rate and request latency for key user journeys. In a single site, you can define SLIs at the edge (e.g., percentage of requests returning non-5xx) and latency thresholds for critical routes such as homepage, search, checkout, or authenticated admin actions. In multi-site estates, you typically define a shared baseline SLO for the platform and allow stricter SLOs for business-critical sites. Implementation details matter: you should compute SLIs from aggregated metrics (Prometheus recording rules) to keep them stable and cost-effective. Burn-rate alerting is often preferable to static thresholds because it detects sustained degradation and fast outages while reducing noise. SLOs also create a governance mechanism: error budgets help decide when to pause feature releases to address reliability work, and they provide a consistent way to communicate reliability trade-offs to product and leadership.
Alert fatigue usually comes from alerts that are not tied to user impact, lack clear ownership, or trigger on symptoms that fluctuate under normal load. The first step is to separate informational monitoring (dashboards) from paging alerts (on-call). We typically design paging alerts around SLIs and burn rates: error rate and latency for user-facing requests, plus a small set of saturation signals that predict imminent failure (for example, PHP-FPM queue growth combined with rising latency). Alerts should include context: affected environment/site, likely components, and a runbook link. Noise reduction techniques include grouping and inhibition (don’t page for downstream symptoms when an upstream dependency is already failing), time-windowed evaluation to avoid transient spikes, and distinct severities for “investigate soon” versus “page now.” Finally, alert quality needs an operational loop. After incidents, review which alerts were useful, which were missing, and which were noisy, then adjust rules and dashboards. This keeps the system aligned with real operational behavior as the platform changes.
Retention should reflect how you use the data: short-term for incident response, medium-term for trend analysis, and long-term for compliance or audit needs. Metrics are usually cheaper to retain than logs, but high-cardinality metrics can become expensive and unstable if not governed. For Prometheus-style metrics, we typically keep high-resolution data for a shorter window and rely on recording rules and downsampling (or long-term storage, if used) for trends. Label cardinality controls are critical: avoid unbounded labels such as full URLs, user IDs, or request IDs. Logs require more deliberate policy. Define what must be retained (security-relevant events, access logs, application errors) and what can be sampled or shortened. Normalize formats and parse only what you need for operational queries. Apply role-based access controls, especially if logs may contain personal data. A practical approach is to start with conservative retention, measure query patterns and storage growth, then adjust. Governance and periodic review prevent observability costs from scaling faster than the platform itself.
Containerized WordPress adds an extra layer where failures can occur, so observability should cover both the container runtime and the services inside it. At the infrastructure level, collect node and container metrics such as CPU, memory, filesystem pressure, network throughput, and restart counts. These signals help distinguish application issues from resource constraints or orchestration behavior. Inside the containers, you still need application-adjacent telemetry: web server metrics, PHP-FPM pool saturation, and dependency health (database, cache). Logs should be shipped from stdout/stderr or log files using a consistent pipeline, then parsed and indexed so teams can search across replicas and environments. A common integration pattern is to label telemetry with environment, service, and instance identifiers so you can aggregate across replicas while still drilling down during incidents. You also want release annotations tied to image tags or deployment events. The key is to avoid treating containers as a black box: combine runtime signals with WordPress-specific indicators so you can diagnose whether the issue is inside the app stack or caused by scheduling, resource limits, or host-level constraints.
ELK is typically used for centralized log aggregation, search, and analysis. In WordPress operations, logs provide the forensic detail that metrics cannot: specific error messages, stack traces, upstream timeouts, authentication failures, and request context that helps explain why an SLI degraded. A useful ELK setup starts with consistent log formats and parsing rules. For example, web access logs should capture status codes, upstream timings, and cache indicators; PHP and application logs should be structured where possible and include correlation fields such as site identifier, environment, and request metadata (without introducing sensitive data). ELK also supports operational workflows: saved searches for common incident patterns, dashboards for error trends, and alerting for specific log-derived conditions (for example, repeated database connection failures). Retention and access control are important, particularly if logs may include personal data or security-relevant events. In practice, ELK complements Prometheus/Grafana: metrics tell you that something is wrong and how widespread it is; logs help you confirm the cause and validate the fix.
Ownership should follow operational responsibility, but it also needs a governance model that prevents drift. A common pattern is shared ownership between platform/SRE teams (for cross-cutting infrastructure and baseline SLIs) and product-aligned teams (for site-specific journeys and integrations). Dashboards benefit from explicit maintainers and a review cadence. Baseline dashboards (platform health, dependency health, SLO views) are typically owned by the platform team. Site or journey dashboards can be owned by the team responsible for that experience, with platform-provided templates to keep consistency. Alerts should have a single accountable owner and a clear on-call route. If an alert pages a team, that team must be able to act on it. Runbooks should be treated as operational code: versioned, reviewed, and updated after incidents. Governance mechanisms include naming conventions, tagging, deprecation policies for unused dashboards, and periodic alert quality reviews. This keeps observability usable as the number of sites, environments, and teams grows.
Observability systems often contain operationally sensitive information, and logs can inadvertently capture personal or confidential data. A secure approach starts with data minimization: collect what you need to operate the platform, and avoid logging payloads, credentials, tokens, or personal identifiers. Access control should be role-based. Not everyone needs raw log access, especially in production. Separate read-only dashboard access from administrative access to data sources and alert configurations. For regulated environments, ensure audit trails exist for access and configuration changes. Retention policies should align with compliance requirements and incident response needs. Encrypt data at rest and in transit, and ensure backups follow the same controls. If you operate across multiple tenants or business units, enforce logical separation via indices, namespaces, or dedicated clusters. Finally, incorporate security signals into observability: authentication anomalies, WAF events, and administrative actions. This supports incident response while keeping the platform’s telemetry compliant and operationally safe.
The most common risk is uncontrolled label cardinality, which can degrade performance and increase storage costs. In WordPress contexts, cardinality often explodes when metrics are labeled with full URLs, query strings, user identifiers, or per-request values. This makes queries slow and can destabilize the monitoring system. Another risk is collecting many low-value metrics without a signal model. This produces dashboards that are hard to interpret and alerts that trigger on incidental fluctuations. It also increases operational overhead because teams must maintain exporters, rules, and dashboards that do not support real decisions. To mitigate these risks, define a metric taxonomy early, restrict labels to bounded sets (environment, site, route group, status class), and use recording rules to pre-aggregate common views. Validate exporter behavior in staging and monitor the monitoring stack itself. The objective is a small set of reliable indicators that support SLIs, incident response, and capacity planning, rather than an exhaustive but fragile collection of metrics.
Yes. Monitoring can look comprehensive while still missing critical failure modes, especially if it focuses on infrastructure health rather than user experience. Green host metrics do not guarantee that WordPress requests are succeeding, that caches are behaving correctly, or that background jobs are completing. Avoiding false confidence requires aligning telemetry to user-impacting SLIs and validating it through operational practice. Define what “good” means for key journeys (availability and latency), then ensure you can detect and explain when those indicators degrade. Add dependency checks that reflect real behavior, such as upstream response timing and error classes, not just “service is up.” You should also test observability with controlled failure scenarios. Game days and incident simulations reveal missing signals, unclear dashboards, and alerts that do not fire when they should. Post-incident reviews should include an observability section: what signals were used, what was missing, and what should be instrumented next. Reliability is not proven by dashboards; it is proven by how quickly teams can detect, diagnose, and recover from real failures.
Timelines depend on the number of environments, sites, and dependencies, but most implementations follow an incremental rollout. A common pattern is to start with a single representative environment and a small set of critical sites, then expand once the signal model is validated. In early weeks, teams align on SLIs/SLOs, telemetry standards, and data flows for metrics and logs. Next, exporters, scrape configuration, and log shipping are implemented, followed by baseline dashboards and initial alert rules. After that, tuning begins: thresholds, grouping, and runbooks are refined based on real operational behavior. For multi-site estates, scaling the model requires templated dashboards, consistent labeling, and governance so new sites inherit the same operational baseline. Integrations with incident management and CI/CD annotations are typically added once core signals are stable. The most important factor is not speed of deployment but quality of signals and operational adoption. A smaller, well-governed set of dashboards and alerts that teams actually use is more valuable than broad coverage that is noisy or inconsistent.
Engagement can be structured to match your operating model. If you have established DevOps/SRE teams, we typically work as an enablement partner: co-design the signal model, implement the initial stack, and transfer ownership through documentation, pairing, and operational validation. If ownership is distributed across multiple product teams, we focus on standardization: shared telemetry conventions, reusable dashboard templates, and alerting policies that route to the correct teams. We also help define governance so observability remains consistent as teams change. For organizations that need more hands-on support, we can implement and operate the observability components for a defined period, including tuning alerts and supporting incident reviews, while building internal capability for long-term ownership. In all cases, responsibilities are clarified early: who owns SLOs, who receives pages, who maintains dashboards, and how changes are requested and reviewed. This prevents observability from becoming an unmanaged toolset rather than an operational system.
Collaboration usually begins with a short discovery focused on your current operational signals and incident patterns. We review the WordPress topology (hosting, caching, database, containers), existing monitoring/logging tools, and the on-call workflow to understand what decisions teams need to make during incidents. From there, we align on a minimal signal model: the SLIs that represent user experience, the supporting saturation and dependency metrics, and the logging requirements for diagnosis. We also agree on governance basics such as naming conventions, label rules, retention, and access control. The next step is a pilot implementation in one environment or a small subset of sites. The pilot includes baseline dashboards, initial alert rules, and a runbook structure. We validate the setup through incident simulations or by observing real operational events, then iterate. Once the pilot is stable and adopted by the on-call team, we scale the approach across additional environments and sites using templates and automation, with a clear ownership and review cadence for long-term maintainability.
These case studies showcase real-world implementations of observability, monitoring, and telemetry governance within complex digital platforms. They highlight approaches to centralized log aggregation, performance monitoring, and alerting strategies that align with WordPress operational needs. The selected work demonstrates measurable improvements in reliability, incident response, and scalable platform architecture relevant to WordPress monitoring and observability services.
UNCCD operated four separate websites (two WordPress, two Drupal), leading to inconsistencies in design, content management, and user experience. A unified, scalable solution was needed to support a large-scale CMS migration project and improve efficiency and usability.
The modernization effort resulted in a cohesive, user-friendly, and scalable website, improving content management efficiency and long-term digital sustainability.
It was my pleasure working with Oleksiy (PathToProject) on a new Drupal website. He is a true full-stack developer—the ideal mix of DevOps expertise, deep front-end knowledge, and the structured thinking of a senior back-end developer.
He is well-organized and never lets anything slip. Oleksiy understands what needs to be done before being asked and can manage a project independently with minimal involvement from clients, product managers, or business analysts.
One of the best consultants I’ve worked with so far.

Andrei Melis
Technical Lead at Eau de Web
Oleksiy (PathToProject) is demanding and responsive. Comfortable with an Agile approach and strong technical skills, I appreciate the way he challenges stories and features to clarify specifications before and during sprints.

Olivier Ritlewski
Ingénieur Logiciel chez EPAM Systems
As Dev Team Lead on my project for 10 months, Oleksiy (PathToProject) demonstrated excellent technical skills and the ability to handle complex Drupal projects. His full-stack expertise is highly valuable.

Laurent Poinsignon
Domain Delivery Manager Web at TotalEnergies
These articles expand on the architecture and governance choices that shape reliable WordPress operations. Together they cover runtime observability, platform health, scheduled job reliability, and the governance patterns that help teams keep telemetry actionable at scale.
Let’s review your current monitoring coverage, define SLIs and SLOs, and design an observability stack that supports incident response and long-term platform operations.