In a monolith, the first question during an incident is often straightforward: which application is unhealthy? In a headless platform, that question is usually too narrow.
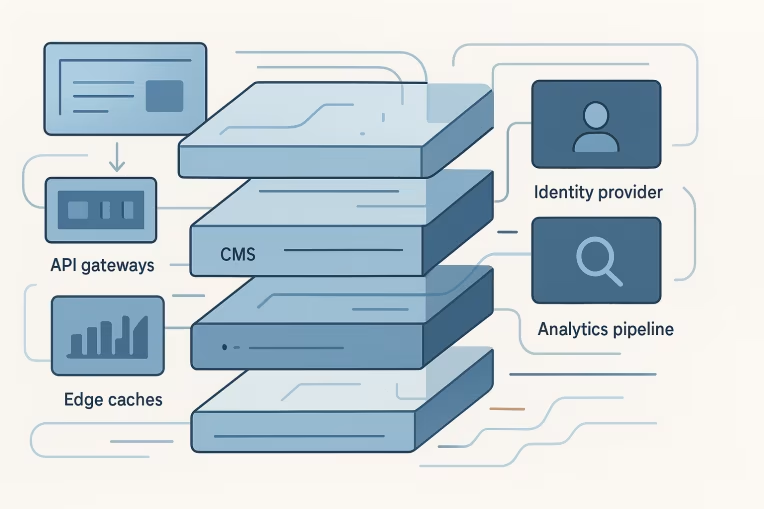
A single customer-facing experience may depend on the frontend application, CDN or edge logic, API gateway, orchestration layer, CMS, search service, identity provider, analytics pipeline, and multiple third-party integrations. Problems move across boundaries. Symptoms show up in one layer while the cause sits in another.
That is why observability for enterprise headless platforms should be designed as part of the platform architecture, not added later as a monitoring checklist. By the time production traffic, authoring complexity, regional delivery, and multiple delivery teams are involved, missing telemetry becomes an operating risk.
Good observability does not mean collecting everything. It means defining the right signals, connecting them across layers, and making ownership clear enough that incident triage can move quickly.
Why headless failures are harder to diagnose than monolith failures
Headless platforms distribute both runtime behavior and operational responsibility.
A page request can involve:
- a cache lookup at the edge
- route handling in the frontend application
- one or more API calls to backend-for-frontend or gateway services
- content retrieval from a CMS or content API
- search queries or recommendations
- identity or session checks
- feature flags, personalization, or analytics events
Each layer can fail differently:
- The edge can serve stale or missing content because of cache key mistakes.
- The frontend can degrade due to hydration issues, client-side exceptions, or slow downstream APIs.
- API orchestration can succeed partially and still produce a broken page state.
- The CMS can return valid responses that are structurally incompatible with the frontend expectation.
- Search can technically respond but miss freshness targets after delayed indexing.
- Identity can create intermittent login or token refresh failures that only affect protected journeys.
These are not theoretical edge cases. They are common consequences of decoupling.
In practice, headless architectures create four diagnosis challenges:
- Symptoms and causes are separated. A user sees a broken page in the frontend, but the root issue may be a content model change or a slow upstream dependency.
- Success can be partial. A request may return
200 OKwhile key content blocks, personalization, or search results are absent. - Teams own fragments of the journey. No single team has all logs, all metrics, or all context unless the operating model is designed for it.
- Business impact is harder to infer from infrastructure data alone. CPU, memory, and request rate do not explain whether users can search, authenticate, view content, or complete a transaction.
That is why platform teams should treat observability as a cross-layer model of user journeys and service dependencies, not just a set of dashboards per component.
The minimum observability model: metrics, logs, traces, and business signals
Most enterprise teams already collect metrics and logs somewhere. The gap is usually not the absence of tooling. The gap is that telemetry is not modeled around how the platform actually fails.
A practical minimum model for headless observability architecture includes four signal types.
1. Metrics
Metrics answer: How much, how fast, how often, and how healthy?
At minimum, define metrics for:
- request volume by route, API, region, and channel
- latency percentiles, not just averages
- error rates by status family and error class
- cache hit and miss rates
- content fetch times
- search query latency and zero-result rates
- authentication success and failure rates
- background indexing or publishing queue lag
Metrics are essential for trend detection and alerting, but on their own they flatten context. They tell you that a route is slower, not necessarily why.
2. Logs
Logs answer: What happened in this specific execution path?
For distributed web platforms, structured logs matter more than verbose logs. Free-text logging becomes difficult to correlate at scale.
Useful structured fields often include:
- timestamp
- environment
- service name
- route or page type
- request or correlation ID
- tenant, locale, market, or brand identifier where relevant
- cache status
- upstream dependency name
- content type or content model version
- authenticated or anonymous session state
- error code and exception class
Logs should help distinguish whether a page failed because content was missing, an API timed out, the schema was incompatible, or an identity dependency rejected a request.
3. Traces
Traces answer: How did this request move across the system?
For frontend API tracing and service-to-service diagnostics, traces are often the fastest way to see dependency chains and latency concentration.
In a headless environment, tracing becomes especially valuable when:
- one page request fans out into many API calls
- only some page components degrade
- user-specific data paths differ from anonymous ones
- edge, frontend, and API timing all need to be compared
Even partial tracing is useful if correlation IDs are consistent across edge, app, and service layers.
4. Business and experience signals
Business signals answer: Did the platform deliver the outcome users and authors expected?
This is the signal type many teams add too late.
Examples include:
- page render success by template or journey type
- content publish-to-live delay
- search result availability and freshness
- add-to-cart or form start/completion continuity where relevant
- preview rendering success rate for content teams
- navigation success for key routes
- percentage of pages served with missing critical content blocks
These signals prevent teams from declaring the platform healthy just because infrastructure is green.
Mapping telemetry across frontend, edge, API gateway, CMS, search, and identity services
The most useful observability model starts with platform boundaries. For each layer, define what it owns, what it emits, and what downstream failures it should expose rather than hide.
Frontend application
The frontend is where user experience becomes visible, so it needs both technical and journey-level telemetry.
Instrument for:
- server-side render duration or page generation time
- client-side route transition latency for app-style experiences
- component-level data dependency failures
- JavaScript errors grouped by route, browser family, and release version
- missing critical content fields at render time
- fallback rendering events when upstream data is unavailable
- Web performance signals tied to page type and market where appropriate
An important distinction: frontend observability should not stop at page-level HTTP success. A page that renders with empty navigation, missing hero content, or failed personalized modules may still return a technically successful response.
CDN and edge layer
Edge observability is often underdeveloped even though the edge can dramatically change what users receive.
Track:
- cache hit, miss, stale, bypass, and revalidation behavior
- origin request rate and origin latency
- cache key dimensions and anomalies
- redirect loops or rule evaluation failures
- geographic or POP-specific error concentration
- edge-render execution failures where edge compute is used
- response header presence for correlation and cache diagnosis
Many hard-to-diagnose incidents sit here. A configuration mistake can amplify origin traffic, expose stale content, or make only certain regions unhealthy. This is also where a stronger caching architecture often pays off operationally, not just in benchmark scores.
API gateway or orchestration layer
This layer should surface both dependency timing and partial response behavior.
Track:
- upstream call counts per request
- latency per dependency
- timeout, retry, and circuit-breaker events where used
- partial data responses and fallback decisions
- request and response payload validation failures
- version or contract mismatches
- rate limiting and authentication failures
If the gateway silently swallows downstream failures and still returns a success response, platform teams lose visibility into degraded experiences. Degradation strategies should be observable events, not hidden implementation details.
CMS and content services
CMS observability should cover more than uptime.
Useful signals include:
- content API latency and error rates
- publish event success and queue lag
- publish-to-availability time in downstream delivery channels
- preview generation success and failure causes
- content model or schema validation errors
- draft vs published mismatch scenarios
- asset retrieval latency and transformation failures
For many enterprise teams, incidents are not caused by a full CMS outage. They are caused by content operations that complete partially, model changes that were valid in one context but incompatible in another, or delayed propagation into delivery layers. Those patterns are usually easier to prevent when headless CMS architecture and observability are designed together.
Search services
Search failures are often subtle. The search API may respond quickly while relevance, freshness, or availability is poor.
Track:
- query latency by index or route
- zero-result rate for priority queries and templates
- indexing lag
- document ingestion failures
- autocomplete availability
- filter/facet error rates
- search abandonment or retry patterns where those signals exist
A useful pattern is separating technical search health from experience health. A low-latency search service with stale indexes is operationally different from a slow but fresh search service.
Identity and access services
Identity problems frequently produce intermittent, journey-specific issues.
Track:
- login success and failure rate
- token issuance and refresh latency
- session validation failures
- access-denied and unauthorized responses by route type
- callback or redirect errors
- third-party identity dependency latency
- protected page load degradation after authentication events
This becomes especially important when only logged-in flows are impacted. Without journey-aware telemetry, teams can misclassify identity issues as generic frontend instability.
Choosing SLIs and SLOs for content delivery and user journeys
For SLOs for headless platforms, the biggest mistake is choosing indicators that are easy to measure but weakly tied to platform value.
A good SLI should represent a user-relevant or operator-relevant outcome. In a headless platform, that usually means mixing technical service indicators with journey indicators.
Consider SLIs in three groups.
Availability SLIs
Examples:
- percentage of successful page responses for priority routes
- percentage of successful content API responses
- percentage of successful authenticated sessions for protected journeys
- percentage of successful preview requests for authors
These are foundational, but availability alone is not enough.
Performance SLIs
Examples:
- p95 page delivery time by route type
- p95 API orchestration latency
- p95 content retrieval latency
- p95 search query latency
- publish-to-live latency for content updates
Performance targets should reflect route and journey differences. A homepage, article page, product listing, and preview environment often need different expectations.
Quality or completeness SLIs
These are especially important for distributed web platform monitoring.
Examples:
- percentage of page renders with all critical content zones populated
- percentage of search requests returning fresh index data within target thresholds
- percentage of preview sessions rendering the latest draft content correctly
- percentage of personalized experiences successfully resolving required audience data
These indicators capture degraded success, which is common in composable systems.
When setting SLOs, start small:
- define a handful of priority journeys
- identify one or two SLIs per journey
- establish a baseline before setting aggressive targets
- align alerting thresholds with customer or author impact
Typical priority journeys may include:
- anonymous content page delivery
- authenticated dashboard or account entry
- on-site search
- content preview
- content publish-to-live propagation
The goal is not to create dozens of SLOs immediately. The goal is to make sure the platform can answer, with confidence, whether key journeys are healthy.
Common blind spots: cache misses, preview failures, schema drift, third-party latency
Most observability gaps do not come from the absence of data everywhere. They come from a small set of blind spots that nobody explicitly owned.
Cache misses and cache behavior ambiguity
Teams often know overall hit rate, but not:
- which routes are missing cache unexpectedly
- whether misses are caused by personalization, query parameters, cookies, or header variance
- whether stale content is being served after publish events
- whether origin load spikes map directly to cache invalidation patterns
Without that visibility, edge issues can look like API or CMS incidents.
Preview failures
Preview is frequently less instrumented than production delivery, even though it is operationally critical for editorial teams.
Common preview blind spots include:
- missing draft content resolution
- authentication handoff failures
- route resolution mismatches between CMS and frontend
- preview-only schema or rendering errors
- author-visible latency that never appears in public traffic dashboards
If preview is a supported workflow, it needs explicit telemetry and service expectations.
Schema drift and contract mismatch
In headless systems, teams often evolve content models and APIs independently. The platform may remain technically online while contract drift breaks rendering.
Instrument for:
- field-level null or missing-value rates for required render inputs
- content model version mismatches
- deserialization or validation errors
- fallback rendering frequency after schema changes
- route-specific increase in empty state rendering
Schema drift is a classic example of why observability should connect delivery reliability with model governance. In practice, this is closely tied to content platform architecture decisions around schema standards, API contracts, and change control.
Third-party latency and dependency opacity
Third-party dependencies can degrade silently.
Examples include:
- identity services slowing token exchange
- recommendation services delaying page composition
- analytics or consent tools blocking render paths
- asset optimization services slowing image delivery
Even when those dependencies are intentionally abstracted behind APIs, teams should preserve dependency-level timing and failure attribution in traces and logs.
Ownership model for incident triage across multiple teams
Technology alone does not solve observability gaps. A distributed platform needs a triage model that reflects its architecture.
A practical ownership model usually includes three layers.
Platform-level responsibility
A central platform or enablement group typically owns:
- telemetry standards
- correlation ID conventions
- minimum instrumentation requirements
- cross-layer dashboards for priority journeys
- shared SLO definitions and reporting
- incident coordination for multi-team failures
This group does not need to own every service. It needs to own the operating framework.
Service-level responsibility
Each domain or delivery team should own:
- instrumentation quality in its service or frontend area
- service-specific runbooks
- dependency mapping and known failure modes
- alert response for the components it builds and changes
If one team owns the API gateway and another owns the frontend, both should emit signals that support end-to-end diagnosis rather than local optimization only.
Experience-level responsibility
Someone should own the health of priority journeys end to end.
This matters because many incidents are cross-functional. For example, a search listing page may involve frontend, gateway, search, identity, and analytics concerns. If nobody owns the journey, every team can claim its component is mostly healthy while customers still experience failure.
Useful triage practices include:
- defining incident routing by journey and dependency map
- maintaining runbooks for common cross-layer failures
- agreeing on what constitutes degraded success
- reviewing incidents for telemetry gaps, not just root cause
- using shared dashboards during incident calls, not separate team-local views only
The best observability programs make handoffs faster because teams have already agreed on identifiers, signals, and escalation rules before incidents happen.
A phased rollout plan for observability without boiling the ocean
Many organizations know they need better observability but stall because the target scope feels too large. A phased approach is more effective.
Phase 1: Define the platform map and priority journeys
Start with architecture reality, not tooling ambition.
Document:
- major runtime layers
- top dependencies per journey
- team ownership boundaries
- highest-impact user and author workflows
- known failure modes from past incidents or delivery experience
This produces the map that later instrumentation should follow.
Phase 2: Standardize telemetry conventions
Before expanding instrumentation, align on:
- correlation ID propagation
- service and route naming
- structured logging fields
- error classification
- environment and market tags
- release or version identifiers
Standardization increases the value of all later telemetry.
Phase 3: Instrument the minimum viable end-to-end path
Choose a small set of critical journeys and make them observable across layers.
For example:
- anonymous page delivery
- content preview
- search journey
- authenticated account entry
For each journey, confirm you can answer:
- did it work?
- was it fast enough?
- where did the time go?
- which dependency failed?
- who owns the next action?
Phase 4: Add SLI and SLO reporting
Once telemetry is reliable, define SLI baselines and a limited set of SLOs.
Use them to improve prioritization, not just alert volume. If a platform repeatedly violates publish-to-live latency or preview success expectations, that should influence roadmap decisions and engineering investment.
Phase 5: Expand into degraded-state and governance signals
After core uptime and latency are visible, instrument the harder but more valuable signals:
- content completeness
- schema drift detection
- cache correctness patterns
- index freshness
- fallback render frequency
- third-party impact attribution
This is where observability becomes a platform capability rather than a monitoring layer.
Phase 6: Close the loop through incident reviews
Every incident should answer two questions:
- what failed?
- what signal should have made diagnosis faster?
That second question is how mature observability programs improve over time. Incident reviews should feed telemetry backlog items, ownership clarifications, and better runbooks. Teams doing broader headless platform strategy work usually get more value when these observability findings feed directly into architecture and operating model decisions.
What good looks like in practice
For enterprise digital platforms, effective headless platform observability usually has a few recognizable traits.
- Teams can trace a high-value journey across edge, frontend, APIs, and core services.
- Dashboards reflect business-critical workflows, not only service internals.
- Degraded success states are visible, not hidden behind
200responses. - Content operations such as preview and publish propagation are treated as first-class reliability concerns.
- Ownership is clear enough that incidents move quickly from detection to responsible action.
- New services and integrations adopt shared telemetry conventions by default.
That does not require a perfect architecture or a single prescribed toolchain. It requires discipline in how the platform models signals, dependencies, and accountability.
In headless environments, incidents rarely expose just one broken component. More often, they expose missing context between components. The teams that perform best are usually the ones that instrument that context early: across the edge, through the frontend, into APIs, around content and search services, and through the workflows that matter to both users and editors.
If your platform cannot currently explain why a page is slow, why preview fails, why publish propagation varies, or which dependency degraded a journey, the observability gap is already architectural. The right time to address it is before production scale turns that gap into a costly investigation.
Tags: Headless, Observability, Enterprise Architecture, Frontend Engineering, API Architecture, Platform Reliability