
 [01]
[01]Discovery and Access
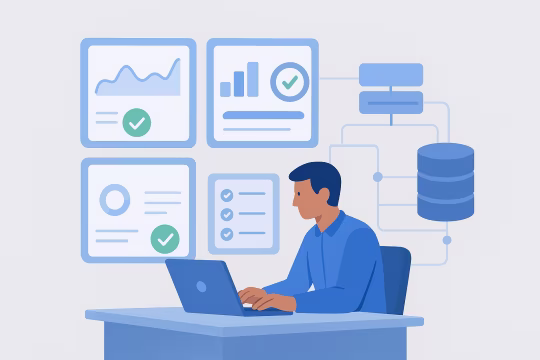
Confirm environments, traffic patterns, and constraints such as hosting, CDN, and release cadence. Establish access to logs, metrics, and code repositories, and agree on success metrics and reporting cadence.
WordPress performance
Check caching, database load, asset delivery, and runtime bottlenecks affecting speed and stability.
Built for high-traffic WordPress environments with measurable performance goals.
No login required. Takes 2–3 minutes.
WordPress performance optimization services focus on identifying bottlenecks across the full request path and removing them with measurable, repeatable changes. This work spans application runtime behavior, WordPress caching strategy, asset delivery and CDN configuration for WordPress, database access patterns, and infrastructure constraints. For enterprise platforms, performance is not only page speed; it is also predictable latency under load, stable deployments, and the ability to scale without introducing fragile, one-off tuning.
Organizations typically need this capability when traffic grows, content models become more complex, plugins accumulate, or multiple teams ship changes without shared performance budgets. Symptoms include inconsistent Core Web Vitals, slow admin/editor experiences, cache inefficiency, and elevated database load.
A platform-oriented optimization approach establishes baselines, defines performance budgets, and implements improvements that are compatible with ongoing delivery. The result is a WordPress stack that remains fast and observable as features evolve, integrations expand, and traffic patterns change.
Core Focus
Best Fit For
Key Outcomes
Technology Ecosystem
Operational Benefits
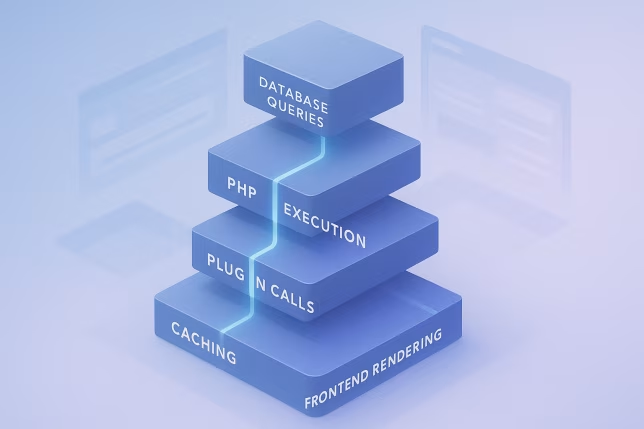
As WordPress platforms grow, performance issues rarely come from a single cause. New plugins add queries and external calls, themes accumulate client-side weight, and content editors create pages with increasingly complex blocks and media. Without a consistent performance model, the request path becomes opaque: some pages are fast, others are slow, and behavior changes between anonymous and authenticated sessions.
Engineering teams then compensate with ad-hoc fixes that don’t generalize. Caching may be enabled but poorly segmented, leading to low hit rates or stale content. CDN configuration may not align with cache headers, causing unnecessary origin traffic. Database load increases due to unindexed queries, inefficient meta lookups, and background jobs competing with user traffic. Frontend changes can improve one metric while regressing another because there is no shared budget or measurement discipline.
Operationally, these issues show up as elevated infrastructure costs, unstable response times during campaigns, and higher incident frequency. Releases become risky because performance regressions are detected late, and remediation requires deep context across WordPress internals, caching layers, and delivery infrastructure.
Establish current performance baselines using synthetic and real-user signals. Capture Core Web Vitals, server timing, cache hit ratios, and database metrics to identify where latency is introduced across the request path.
Profile PHP execution, WordPress hooks, plugin behavior, and database queries. Map slow endpoints and templates to specific causes such as N+1 queries, expensive meta queries, external API calls, or uncacheable responses.
Design page, object, and CDN caching layers aligned to content variability and authentication rules. Define cache keys, TTLs, purge strategy, and header policies so caching improves speed without breaking correctness.
Tune MySQL configuration and query patterns based on observed workload. Add targeted indexes, reduce expensive meta lookups, and adjust background processing to minimize lock contention and reduce peak query latency.
Optimize asset delivery and rendering behavior with a focus on LCP, INP, and CLS. Improve caching headers, compression, image strategy, and critical path resources while keeping changes compatible with theme and block patterns.
Validate improvements under realistic traffic profiles and content mixes. Add performance regression checks to CI where feasible, and confirm that caching behavior and database performance remain stable under concurrency.
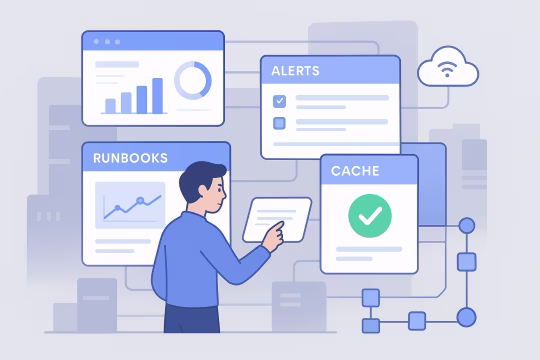
Implement dashboards and alerts for latency, error rates, cache efficiency, and database health. Ensure teams can correlate releases with performance changes and diagnose issues using consistent telemetry.
Define performance budgets, ownership, and review checkpoints for ongoing work. Create a backlog of optimizations and guardrails so future features and plugin changes do not reintroduce systemic bottlenecks.
This service focuses on measurable improvements across the full WordPress delivery path: PHP runtime behavior, WordPress caching strategy, database access, and frontend rendering. The emphasis is on repeatable engineering changes that can be monitored, tested, and maintained over time, including WordPress Core Web Vitals engineering where it impacts real user journeys. Work is guided by baselines and budgets so performance remains stable as content, plugins, and traffic patterns evolve.
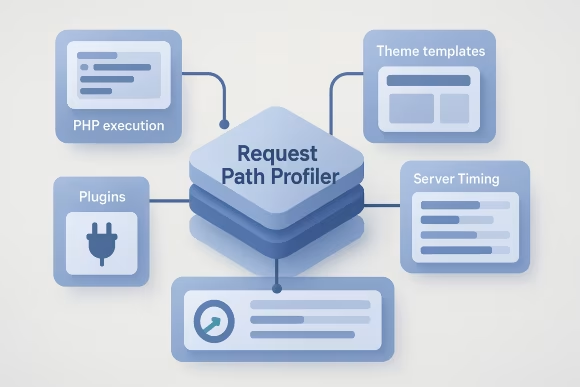
Instrument and profile WordPress requests to isolate latency contributors across PHP execution, theme templates, plugins, and external calls. Use server timing, query logs, and targeted profiling to connect slow pages and endpoints to specific code paths and data access patterns.
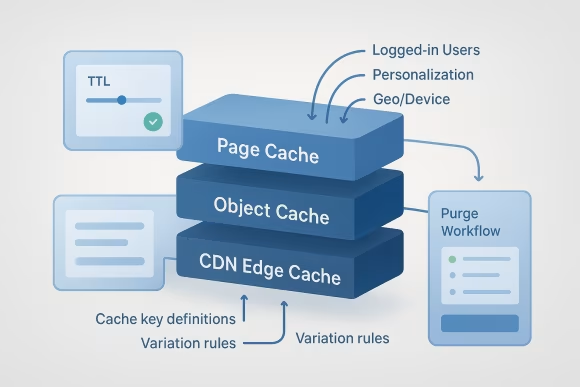
Implement coherent caching across page caching, object caching, and CDN edge caching. Define cache keys and variation rules for logged-in users, personalization, and geo/device differences, and align TTL and purge mechanisms with editorial workflows and deployment patterns.
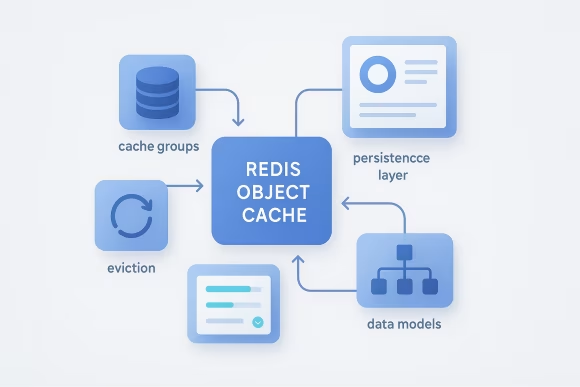
Configure Redis-backed object caching to reduce repeated computation and database reads. Validate cache groups, persistence behavior, and eviction patterns, and ensure cache invalidation is correct for content updates, taxonomy changes, and plugin-driven data models.

Reduce database pressure by addressing slow queries, missing indexes, and inefficient meta/table access patterns. Tune MySQL parameters for the observed workload, improve query plans, and adjust WordPress and plugin usage that triggers high-cardinality lookups.
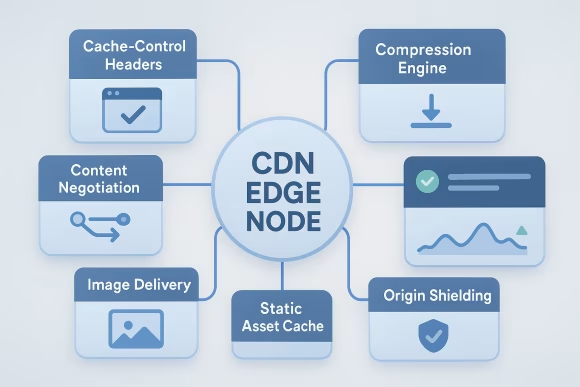
Optimize edge delivery with correct cache-control headers, compression, and content negotiation. Improve static asset caching, image delivery strategy, and origin shielding to reduce TTFB and stabilize performance during traffic spikes and regional demand.
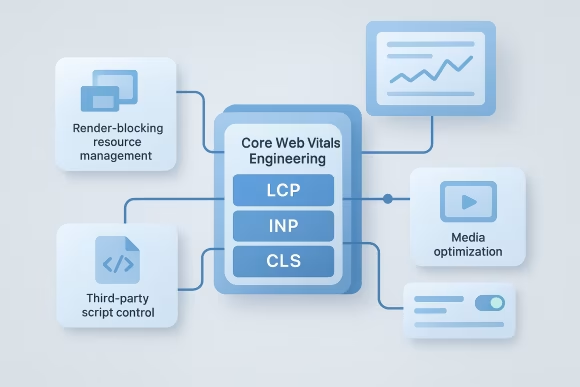
Target LCP, INP, and CLS with changes that improve rendering predictability and reduce main-thread work. Address render-blocking resources, heavy third-party scripts, and oversized media while keeping theme and block implementations maintainable.

Introduce performance budgets, repeatable test scenarios, and release checks to detect regressions early. Combine synthetic tests with production monitoring so teams can validate that new features, plugins, and content patterns stay within agreed thresholds.
Use the Health Check to surface bottlenecks across request flow, cache behavior, and Core Web Vitals.
Engagements follow a clear engineering sequence from discovery through implementation and long-term evolution. Work starts with baseline measurement and profiling, then moves through WordPress caching strategy, CDN configuration for WordPress, and MySQL performance tuning for WordPress platforms, with validation under load and ongoing observability to sustain gains.
[01]Confirm environments, traffic patterns, and constraints such as hosting, CDN, and release cadence. Establish access to logs, metrics, and code repositories, and agree on success metrics and reporting cadence.
 [02]
[02]Measure current performance using a defined set of representative pages and user journeys. Establish performance budgets and thresholds that align with platform goals and can be tracked over time.
 [03]
[03]Review caching layers, CDN behavior, and WordPress runtime configuration to identify structural constraints. Produce a prioritized plan that sequences changes to minimize risk and maximize measurable impact.
 [04]
[04]Apply targeted improvements across PHP runtime, caching configuration, database access patterns, and frontend delivery. Changes are implemented with rollback paths and documented operational considerations.
 [05]
[05]Validate improvements against baselines and run load tests where peak traffic risk exists. Confirm cache correctness, purge behavior, and database stability under concurrency and realistic content variability.
 [06]
[06]Add dashboards, alerts, and runbooks for performance and cache health. Ensure teams can correlate releases with metric changes and diagnose regressions with consistent telemetry.
 [07]
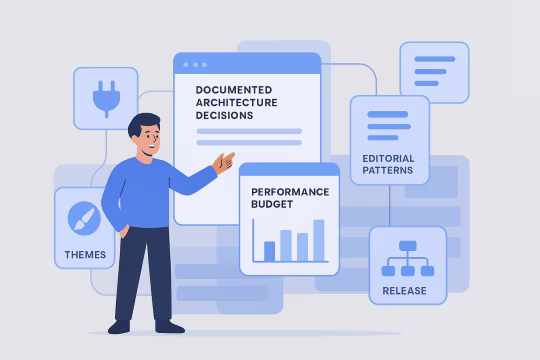
[07]Document architecture decisions, configuration, and performance budgets. Provide guidance for plugin/theme changes, editorial patterns, and release processes that commonly affect performance.
 [08]
[08]Maintain a performance backlog and review cadence to prevent drift. Periodically reassess traffic patterns, new features, and third-party scripts to keep Core Web Vitals and platform latency within targets.
Performance work is treated as an operational capability: measurable improvements, reduced variance under load, and controls that prevent regressions. For high-traffic WordPress operations, the impact is realized through faster user experiences, more predictable releases, and lower platform risk during campaigns and peak events.
Reduced TTFB and improved LCP shorten time-to-content for key pages. Improvements are validated against representative templates and content patterns, not only a single homepage benchmark.
Higher cache hit ratios and reduced origin load stabilize latency during campaigns and traffic spikes. This lowers the probability of cascading failures caused by database saturation or PHP worker exhaustion.
Database and runtime optimizations reduce CPU, memory, and I/O contention. Teams can often defer scaling actions or scale more efficiently because the platform does less work per request.
Performance budgets and regression checks make it easier to detect degradations close to the change that caused them. This shortens remediation cycles and reduces the need for emergency rollbacks.
Dashboards and alerts provide early signals for cache inefficiency, slow queries, and rising error rates. Teams can correlate incidents with deployments, content changes, or third-party behavior more quickly.
Optimizations that reduce backend load and improve admin responsiveness help editors work reliably during busy periods. This is especially relevant for platforms with heavy content operations and scheduled publishing.
By addressing systemic bottlenecks and documenting constraints, teams avoid accumulating fragile tuning and one-off fixes. The platform remains maintainable as plugins, themes, and integrations evolve.
Performance review
Review bottlenecks, caching gaps, and delivery issues before they impact traffic, releases, or conversion.
Adjacent capabilities that extend WordPress operational maturity across deployment, security, architecture, and quality controls.
WordPress REST API engineering and GraphQL API design
GA4 event tracking WordPress with governed measurement
WordPress lead contact sync with secure lead capture
WordPress integration services for secure API connections
Custom WordPress REST endpoints, schemas, and authentication patterns
Upgrade-ready architecture, WordPress CI/CD and DevOps, and operational hardening
Enterprise WordPress Platform Engineering
WordPress platform strategy consulting: architecture principles, governance, and roadmap definition
Enterprise WordPress network design for multi-site ecosystems
Common questions about performance optimization scope, measurement, operational impact, and how work is governed in enterprise WordPress environments.
We start by mapping the request types and variability: anonymous vs authenticated traffic, personalization, geo/device variation, and content update frequency. From there we design a layered approach that typically includes CDN edge caching for static assets and cacheable HTML, plus an application-side object cache (often Redis) to reduce repeated computation and database reads. The key architectural decision is cache correctness: defining cache keys, variation rules, and invalidation/purge strategy so cached responses remain accurate. For example, logged-in experiences often require bypassing full-page caching but can still benefit from object caching and selective fragment caching. We also align cache TTLs and purge triggers with editorial workflows and deployment processes. Finally, we validate the design with measurements: cache hit ratios, origin request rates, TTFB distribution, and error rates under load. The outcome is a caching architecture that improves performance without creating hidden content consistency issues or operational fragility.
We prioritize metrics that reflect user experience and operational stability. On the user side, Core Web Vitals (LCP, INP, CLS) are important, but we also track TTFB and server timing to understand backend contribution. For content-heavy platforms, we segment by template type and page weight because a single global score can hide critical regressions. On the platform side, we track cache efficiency (edge and origin hit ratios), PHP worker utilization, database query latency and throughput, and error rates. These metrics help explain whether improvements are sustainable under peak traffic and whether the platform is trending toward saturation. We also define performance budgets tied to release processes: thresholds for key templates, limits on third-party script impact, and acceptable variance under load. The goal is not only to improve a snapshot score, but to keep performance predictable as features and content evolve.
Regression prevention is treated as an operational control problem, not a one-time tuning exercise. We establish baselines and performance budgets for representative pages and journeys, then connect those budgets to release workflows. Depending on the environment, this can include synthetic checks in CI, scheduled tests against staging, and production monitoring with alerts on key thresholds. We also focus on the common regression sources in WordPress: plugin updates that introduce new queries or external calls, theme changes that increase client-side work, and editorial patterns that produce heavier pages over time. For each, we document constraints and provide guidance so teams can evaluate changes before they reach production. Finally, we ensure observability is in place: dashboards for latency distribution, cache hit ratios, slow queries, and error rates. When regressions occur, teams can correlate them with deployments or content changes and remediate quickly with clear ownership.
Production observability combines user-facing signals with platform telemetry. On the user side, we use real-user monitoring (RUM) to track Core Web Vitals and page-level performance by template, device, and geography. This helps distinguish localized CDN issues from application bottlenecks and highlights which experiences matter most. On the platform side, we instrument the request path: web server metrics, PHP-FPM pools, application logs, cache metrics (CDN and Redis), and database health (slow query logs, query latency, connections, buffer pool behavior). Where feasible, we add tracing or structured timing so slow requests can be decomposed into phases. The practical output is a set of dashboards and alerts that answer operational questions quickly: “Is the CDN serving correctly?”, “Did cache hit ratio drop after a release?”, “Which queries are driving load?”, and “Is latency increasing due to CPU, I/O, or external dependencies?”
The integration hinges on correct cache-control headers, variation rules, and purge behavior. We classify responses by cacheability and define how the CDN should treat them: fully cacheable HTML for anonymous traffic, pass-through or short-lived caching for semi-dynamic pages, and strict no-cache for sensitive authenticated content. We also align WordPress behavior with the CDN: ensuring cookies that should not vary cache are not unnecessarily set, defining which query parameters are cache keys, and configuring edge rules for redirects, compression, and image delivery. Purge strategy is critical for editorial platforms; we implement targeted purges (by URL, tag, or surrogate keys) so updates propagate quickly without flushing the entire cache. Finally, we validate with controlled tests: header inspection, cache hit/miss analysis, and content correctness checks across regions. The goal is improved performance and reduced origin load without introducing stale or inconsistent content delivery.
Redis object caching reduces repeated database reads and expensive computations by storing results of common lookups in memory. MySQL tuning improves the performance of the queries that still need to run, and it ensures the database remains stable under concurrency and background workloads. We treat them as complementary layers. First, we identify which queries are frequent and costly, and whether they are safe to cache given content update patterns. Then we configure Redis with appropriate cache groups and validate invalidation behavior so cached data stays correct. In parallel, we optimize MySQL: indexes for high-cardinality lookups, query plan improvements, and configuration tuned to the workload (connections, buffer pool sizing, I/O behavior). We validate the combined effect using metrics: reduced query volume, lower query latency, improved TTFB distribution, and stable database resource usage during peaks. This avoids the common failure mode where caching masks underlying database inefficiencies until a cache miss storm occurs.
We introduce lightweight governance that fits engineering workflows: clear performance budgets, ownership, and review checkpoints. Budgets are defined per template or journey (not just a site-wide score) and include both frontend and backend thresholds such as LCP/INP targets, TTFB ceilings, and limits on third-party script impact. For multi-team environments, we recommend a shared definition of “performance-sensitive changes” (themes, plugins, global scripts, caching rules, database migrations) and a review path for those changes. This can be implemented as pull request checklists, automated checks where feasible, and periodic performance reviews tied to release cycles. We also ensure the platform has feedback loops: dashboards visible to teams, alerts that route to the right owners, and post-release validation. Governance is successful when teams can move quickly while still detecting and preventing regressions before they become incidents.
We treat invalidation as part of the content lifecycle. First, we identify which content changes must be reflected immediately (breaking news, regulated updates) versus what can tolerate short TTLs. Then we design purge mechanisms that are targeted and observable: purging specific URLs, using tags/surrogate keys, or purging by content relationships when templates aggregate multiple items. Governance includes defining who can trigger purges, how purges are audited, and what safeguards exist to prevent accidental full-cache flushes. We also document how deployments interact with caching, including when to purge assets versus HTML, and how to manage versioned assets to avoid unnecessary purges. Finally, we validate correctness with automated and manual checks: ensuring updated content appears across regions, verifying headers, and monitoring cache hit ratios after major publishing events. The goal is fast propagation without sacrificing cache efficiency or operational stability.
The most common risks are correctness regressions, hidden coupling, and changes that improve one metric while degrading another. Caching changes can introduce stale or incorrect content if variation rules and invalidation are not precise. Database tuning can cause unexpected behavior if indexes or configuration changes are applied without understanding query patterns and write workloads. We mitigate these risks by working from baselines and controlled experiments. Each change is tied to a hypothesis and validated with measurable outcomes: cache hit ratios, latency distributions, error rates, and content correctness checks. We use staged rollouts where possible and ensure rollback paths exist for configuration changes. We also pay attention to plugin and theme constraints. Some bottlenecks are caused by third-party code that cannot be easily modified; in those cases we focus on safe containment strategies such as selective caching, edge rules, or isolating expensive operations. The objective is performance improvement without introducing operational fragility.
We validate peak readiness by combining load testing with production-like configuration and realistic content variability. The goal is to test the platform’s limiting factors: PHP worker pools, database concurrency, cache behavior under churn, and CDN/origin interactions. For enterprise platforms, it’s important to model both steady-state traffic and burst patterns. We define scenarios based on analytics and known events: top landing pages, search and filtering behavior, and content update bursts that trigger cache invalidation. During tests we monitor latency percentiles, error rates, cache hit ratios, database query latency, and resource saturation signals. We also test failure modes: what happens when the cache is cold, when a purge occurs, or when an external dependency slows down. The output is a set of capacity and configuration recommendations, plus operational runbooks for peak periods so teams can respond predictably if conditions change.
Scope and timeline depend on platform complexity and access to telemetry, but a common structure is: 1) baseline and bottleneck analysis, 2) prioritized implementation, 3) validation and operationalization. For many enterprise sites, initial discovery and measurement can be completed in one to two weeks, followed by one or more implementation sprints. If the platform has significant plugin complexity, multiple environments, or limited observability, the early phase may include additional instrumentation work. Implementation often focuses first on high-leverage changes: caching correctness and efficiency, database hotspots, and the heaviest templates affecting Core Web Vitals. We aim to deliver measurable improvements early, then stabilize them with budgets, dashboards, and regression controls. Longer engagements typically shift toward continuous improvement: addressing deeper architectural constraints, refining purge governance, and supporting teams as new features and integrations are introduced.
Collaboration typically begins with a short scoping workshop and an access checklist. In the workshop we align on the primary symptoms (e.g., poor LCP on key templates, high TTFB, database saturation), define success metrics, and identify constraints such as hosting model, CDN capabilities, and release cadence. Next, we request access to the minimum set of systems needed to measure and diagnose: code repositories, staging and production observability (logs, metrics, RUM/synthetic where available), CDN configuration, and database performance signals. If telemetry is limited, the first step is to add lightweight instrumentation so decisions are evidence-based. We then produce a baseline report and a prioritized plan with clear sequencing, risk notes, and validation steps. This plan becomes the working backlog for implementation sprints, with regular check-ins to review measured impact and adjust priorities as new findings emerge.
These case studies showcase engineering-led performance optimization and modernization efforts relevant to WordPress and similar CMS platforms. They highlight measurable improvements in caching strategies, query optimization, CDN configuration, and scalable delivery models that align closely with the service's focus on predictable latency, Core Web Vitals, and operational stability. Together, they provide practical insights into delivering high-traffic, content-rich platforms with robust performance engineering.
UNCCD operated four separate websites (two WordPress, two Drupal), leading to inconsistencies in design, content management, and user experience. A unified, scalable solution was needed to support a large-scale CMS migration project and improve efficiency and usability.
The modernization effort resulted in a cohesive, user-friendly, and scalable website, improving content management efficiency and long-term digital sustainability.
Oleksiy (PathToProject) is demanding and responsive. Comfortable with an Agile approach and strong technical skills, I appreciate the way he challenges stories and features to clarify specifications before and during sprints.

Olivier Ritlewski
Ingénieur Logiciel chez EPAM Systems
As Dev Team Lead on my project for 10 months, Oleksiy (PathToProject) demonstrated excellent technical skills and the ability to handle complex Drupal projects. His full-stack expertise is highly valuable.

Laurent Poinsignon
Domain Delivery Manager Web at TotalEnergies
It was my pleasure working with Oleksiy (PathToProject) on a new Drupal website. He is a true full-stack developer—the ideal mix of DevOps expertise, deep front-end knowledge, and the structured thinking of a senior back-end developer.
He is well-organized and never lets anything slip. Oleksiy understands what needs to be done before being asked and can manage a project independently with minimal involvement from clients, product managers, or business analysts.
One of the best consultants I’ve worked with so far.

Andrei Melis
Technical Lead at Eau de Web
These articles expand on the platform and operational decisions that shape WordPress speed at scale. They cover caching, origin capacity, observability, and the governance issues that often create performance regressions over time.
Share your current constraints, traffic patterns, and performance targets. We will establish baselines, identify bottlenecks across caching, database, and delivery, and propose a prioritized optimization backlog with validation steps.