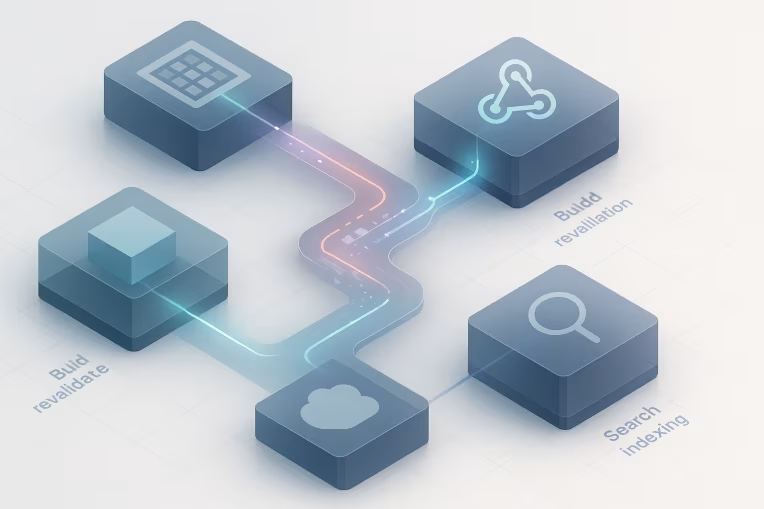
For enterprise headless teams, publishing reliability is rarely a single-system problem. A content update can begin in a CMS, trigger a webhook, pass through queues or orchestration services, initiate a build or revalidation path, propagate through caches, and eventually appear in onsite search and live customer journeys. At every step, the platform may report that it is "up" while editors still experience missed launches, stale pages, broken preview, or delayed search visibility.
That gap is why uptime alone is not enough.
If your operating model treats the CMS, frontend hosting layer, CDN, and search engine as separate services with separate dashboards, you can easily miss the outcome that matters most: did an intended content change become reliably visible to customers within an acceptable time window?
For most enterprise digital platforms, that is the real service being delivered to editorial and content operations teams.
Why uptime is not the same as publishing reliability
Traditional availability metrics answer a narrow question: was a service reachable? That matters, but it does not capture whether the publishing workflow actually worked from end to end.
A headless publishing chain can fail even when every individual component looks healthy in isolation:
- The CMS is available, but webhook delivery is delayed.
- The webhook fires, but the downstream build job only partially completes.
- The new page is rendered, but stale CDN objects continue to be served in one region.
- The page is live, but onsite search still shows old metadata or omits the content entirely.
- Preview works for some content types but fails for localized variants or unpublished dependencies.
From an editor's perspective, these are all publishing incidents.
From an SRE perspective, they are often distributed-system issues that cross product, infrastructure, and workflow boundaries.
This is why headless publishing reliability should be treated as a user-facing operational concern. The users are not only customers visiting the site. They are also editors, merchandisers, campaign teams, and content operators who depend on predictable publishing behavior to run the business.
A useful SLO model must therefore focus on outcomes, not just component health.
The publish path: CMS event, webhook, build, cache, search, frontend
To define meaningful editorial SLOs, start by mapping the publish path in concrete terms. The exact architecture varies, but many enterprise platforms include some version of the following sequence:
-
Editorial action in the CMS
An editor publishes, schedules, updates, or unpublishes content. -
Event generation
The CMS emits an event, webhook, or change notification. -
Event transport and orchestration
Middleware, queues, serverless functions, or integration services validate and route the event. -
Content delivery update
Depending on the architecture, the platform triggers a full build, partial build, page regeneration, API cache refresh, or on-demand revalidation. -
Cache propagation
CDN nodes, application caches, and edge layers update or invalidate stale content. -
Dependent system updates
Search indexing, recommendation systems, navigation services, personalization layers, or feed consumers process the changed content. -
Frontend visibility
The customer-facing page, listing, component, or search result reflects the intended change. -
Preview confidence
Editors can validate the expected result before or during release workflows.
This flow matters because reliability can degrade at the seams. In multi-brand and multi-region platforms, those seams multiply quickly. A content change may be live in one market, stale in another, visible on the product page but not in search, or correct on the primary domain while still cached on edge nodes for localized traffic.
If you do not explicitly model the path, your observability will remain fragmented.
Which failure modes matter most to editors and platform owners
Not every technical fault deserves equal attention. Focus first on the failure modes that directly affect editorial confidence and business operations.
Common high-value failure modes include:
- Delayed publish propagation: the content is eventually correct, but only after an unacceptable delay.
- Failed publishes: the editor receives success feedback, but the change never reaches production.
- Partial publishes: some pages, locales, fragments, or content dependencies update while others remain stale.
- Stale search or stale navigation: the destination page is live, but supporting discovery systems are not updated.
- Broken preview: editors cannot trust preview to represent what will go live.
- Inconsistent cache invalidation: changes appear differently by region, session, device, or edge location.
- Silent data mismatch: structured content updates render incorrectly because downstream schemas, mappings, or transforms drifted.
These issues hurt more than technical neatness. They affect launch timing, campaign readiness, governance, and trust in the platform team.
When editorial teams stop trusting the publishing chain, they compensate with manual checks, duplicate publishing, delayed launches, and escalations. That creates hidden operational cost even when incident counts appear low.
Defining useful SLOs: publish-to-live latency, failed publishes, stale search, broken preview
Good SLOs translate a complex delivery path into a small number of measurable promises. They should be understandable to engineering and content stakeholders alike.
For publishing SLOs for headless platforms, a practical starting set often includes four categories.
1. Publish-to-live latency
This measures the time from a valid editorial publish action to customer-visible availability.
The exact endpoint should be defined carefully. For example:
- Time from CMS publish event to updated page response on the canonical URL
- Time from CMS publish event to updated content visible on all required production regions
- Time from scheduled publish timestamp to live state on customer-facing channels
This is usually the core reliability metric because it reflects the business expectation behind publishing.
A few implementation tips:
- Measure percentiles, not just averages.
- Separate content classes if their paths are materially different, such as landing pages versus product detail pages.
- Distinguish between normal operational targets and higher-priority launch content if your governance model requires it.
2. Failed publish rate
This captures the percentage of publish attempts that do not complete successfully within the defined time window or terminal success criteria.
A useful definition should distinguish between:
- hard failures, where content never becomes live
- soft failures, where it becomes live but exceeds the allowed latency window
- partial failures, where some required destinations update and others do not
This is where many teams discover that their current monitoring is too narrow. A build status of success does not guarantee a successful publish outcome if search, cache invalidation, or dependent pages did not update.
3. Stale search or stale discovery rate
Search, navigation, and listings are often treated as secondary systems, but they are part of the publishing experience. A page that is technically live but not discoverable may still be operationally broken.
Metrics in this area can include:
- time from publish to updated search index availability
- percentage of newly published items not searchable within target time
- percentage of modified metadata not reflected in search snippets or filters within target time
For many organizations, search indexing latency deserves a distinct SLO or at least a clearly tracked companion indicator.
4. Preview reliability
Preview is a confidence system. If editors cannot trust it, publishing risk rises.
Preview-related SLOs can include:
- successful preview render rate
- preview freshness relative to CMS draft state
- preview time to usable render
- percentage of preview sessions with missing dependencies or authorization errors
Broken preview may not be customer-visible immediately, but it drives avoidable publishing errors and escalations.
Instrumentation patterns across CMS, queues, APIs, CDN, and search
Once the SLOs are defined, the next challenge is instrumentation. The goal is not to instrument everything. It is to create an observable chain of evidence for each publish event.
A practical pattern is to assign a publish correlation ID or equivalent trace context at the moment of editorial action or event emission. That identifier can then travel through the pipeline:
- CMS event or webhook payload
- queue message or orchestration workflow
- build or revalidation job
- cache invalidation request
- search indexing task
- synthetic verification check against the live URL or API response
This does not always require fully distributed tracing in the strictest sense. In many organizations, headless observability can begin with structured logs and event timestamps that are enough to establish a reliable lifecycle record.
Useful instrumentation points often include:
CMS and event layer
Capture:
- publish action timestamp
- content identifier and type
- locale, market, or brand scope
- scheduled versus immediate publish flag
- webhook delivery attempt and acknowledgement status
This establishes the start of the SLO measurement window.
Queue and orchestration layer
Capture:
- enqueue time
- dequeue or processing start time
- retry count
- dead-letter routing
- downstream job creation status
This helps reveal whether latency is caused by backlog, retry storms, or integration bottlenecks.
Build, regeneration, or delivery update layer
Capture:
- job start and completion time
- scope of generated assets or invalidated paths
- partial success conditions
- schema or data transformation failures
- deployment promotion status where relevant
This is critical for platforms using static generation, incremental regeneration, API-based rendering, or hybrid delivery models. Teams working through static site generation architecture decisions often find that publish latency becomes much easier to reason about once build, revalidation, and cache behavior are measured as one chain.
CDN and edge layer
Capture:
- invalidation request time
- acknowledgment from edge providers or internal edge services
- cache hit or miss behavior on validation probes
- region-specific freshness checks
This is where cache propagation monitoring becomes valuable. A cache purge request is not the same as customer-visible freshness, especially on globally distributed platforms with complex edge infrastructure architecture.
Search and secondary indexing layer
Capture:
- indexing request time
- index update completion time
- query visibility validation time
- mismatch between source content and indexed representation
This is often the least mature part of the chain, yet one of the most visible to business users.
Frontend verification layer
Run synthetic or event-driven checks that confirm the actual customer experience:
- fetch the canonical URL and verify updated content markers
- validate key fields in rendered HTML or API response
- test selected regions or locales
- check search discoverability where relevant
Without this last-mile verification, many teams end up measuring system activity rather than publishing success.
Error budgets, alerting, and ownership boundaries
An SLO without an ownership model becomes a reporting artifact. To be operationally useful, publishing SLOs need clear accountability.
In enterprise headless environments, ownership is usually shared:
- the content platform team may own CMS events and delivery integrations
- frontend engineering may own rendering behavior and revalidation paths
- cloud or platform operations may own queues, compute, and runtime health
- search or data teams may own indexing pipelines
- content operations may own workflow quality and escalation input
The challenge is that the editorial user experiences a single service, while engineering ownership is split.
A practical approach is to define:
- a service owner for the end-to-end publishing outcome
- component owners for each stage of the path
- handoff rules for incidents and budget consumption
For example, the end-to-end publishing service can have an error budget tied to failed or delayed publishes. When budget burn increases, teams can investigate which layer is responsible, but they still respond against the shared user outcome first.
Alerting should also reflect severity in editorial terms.
Useful alert patterns include:
- sudden increase in publish-to-live latency percentile
- repeated failed publish verification for a specific content type or market
- stale search visibility beyond acceptable threshold
- preview failure rate crossing a threshold during business hours
- regional cache freshness failures after a high-volume campaign publish
Avoid alerting on every single webhook retry or cache invalidation event unless it threatens the end-user objective. Otherwise, teams end up with noisy infrastructure alerts that do not correspond to editorial pain.
How to introduce publishing SLOs without over-instrumenting everything
Many teams delay this work because the system is complex and the ideal observability model feels expensive. The better approach is phased adoption.
Phase 1: define the business-critical publish journeys
Start with a small number of high-value journeys, such as:
- publish a marketing landing page update
- publish a product or content detail page update
- update metadata that must appear in onsite search
- preview and publish a localized page
You do not need universal coverage on day one. You need representative journeys that matter to the business.
Phase 2: agree on success criteria
For each journey, define:
- what starts the timer
- what ends the timer
- what counts as success, delay, partial failure, or total failure
- which regions, channels, and dependent systems are in scope
This alignment is often more valuable than the tooling itself because it exposes hidden assumptions.
Phase 3: add minimum viable instrumentation
Implement timestamp capture and verification at the most important control points. In many cases, you can begin with:
- CMS event timestamp
- orchestration receipt timestamp
- build or revalidation completion timestamp
- synthetic verification timestamp for live content
- search visibility check for selected content classes
This provides a baseline for content operations metrics without requiring full observability replatforming.
Phase 4: separate component telemetry from service SLOs
Keep your service-level publishing metrics distinct from lower-level engineering metrics. Queue depth, function duration, build success rate, and CDN purge acknowledgements are useful diagnostics, but they are not the primary promise to editorial stakeholders.
This distinction prevents a common failure mode: teams report strong infrastructure health while publish outcomes remain inconsistent.
Phase 5: evolve thresholds based on experience
Do not invent arbitrary precision on day one. Start with conservative targets based on known workflows and operational tolerance. Then refine after observing actual latency distributions, incident patterns, and editorial expectations.
This approach is especially important in multi-brand or multi-region environments, where different content journeys may justify different service levels.
Practical design principles for publish reliability measurement
Across implementations, a few principles usually help.
First, measure the experience of a successful publish, not just the activity of the pipeline. A completed job is not proof of live correctness.
Second, treat partial success explicitly. Enterprise content delivery often fails asymmetrically across locales, brands, search surfaces, or edge regions.
Third, prefer verification over assumption. If possible, check that the updated page or result is actually visible.
Fourth, keep editorial language in the operating model. Terms like publish delay, stale search, and broken preview are more actionable across teams than narrowly technical labels alone.
Fifth, design metrics that support ownership conversations, not blame assignment. The point of publishing SLOs is to make the cross-system service visible and improvable.
Conclusion
Publishing reliability in headless architecture is an end-to-end property. It cannot be captured by CMS uptime, frontend availability, or pipeline success in isolation. For editorial teams, the platform succeeds only when a content change moves predictably from authoring intent to live customer experience.
That is why publishing SLOs for headless platforms matter. They give enterprise teams a practical way to measure the service that editors actually consume: timely, complete, trustworthy publishing across CMS events, builds, caches, search, preview, and edge delivery.
If you start with a few critical journeys, define clear success criteria, instrument the path with lightweight correlation and verification, and assign ownership around the end-to-end outcome, you can create a reliability model that is both operationally credible and editorially meaningful. Programs such as Alpro show how multi-region headless delivery can benefit from tighter alignment between publishing triggers, build behavior, and search visibility.
The result is not just better monitoring. It is a more dependable publishing platform, stronger trust between teams, and a clearer foundation for scaling headless delivery across brands, regions, and business-critical content workflows.
Tags: Headless, SRE, Observability, Content Operations, CMS, Search, Frontend Engineering