 [01]
[01]Discovery and Baseline
Map the headless architecture, critical journeys, and current monitoring coverage. Establish initial hypotheses for failure modes and define the minimal set of signals required for reliable operations.
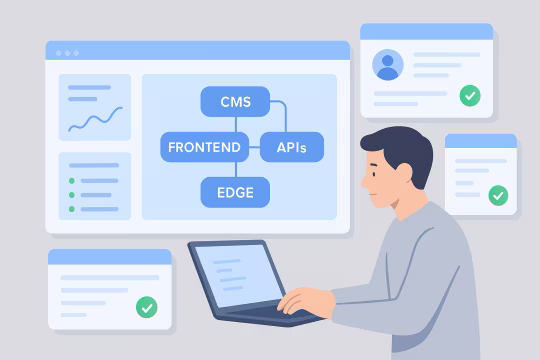
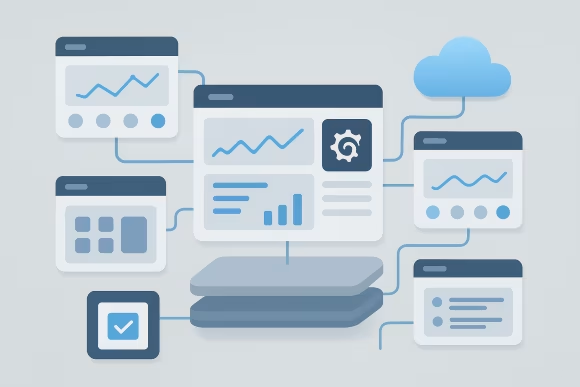
Headless platforms distribute user experiences across multiple services: CMS, frontend delivery, APIs, identity, search, and edge components. Headless platform observability makes this architecture operable by turning runtime behavior into actionable signals: metrics for health and capacity, distributed tracing for microservices request paths and latency, and logs for diagnostic context.
Organizations need this capability when incident response depends on tribal knowledge, when API performance monitoring is inconsistent, or when performance regressions are detected late. Without OpenTelemetry instrumentation standards and shared dashboards, each team optimizes locally while platform reliability degrades globally.
A well-designed observability layer supports scalable platform architecture by standardizing telemetry, defining service-level indicators and objectives, and enabling correlation across components. This creates a feedback loop between engineering and operations: deployments can be evaluated against SLOs, capacity can be planned from real usage, and architectural changes can be validated with measurable impact.
Core Focus
Best Fit For
Key Outcomes
Technology Ecosystem
Delivery Scope
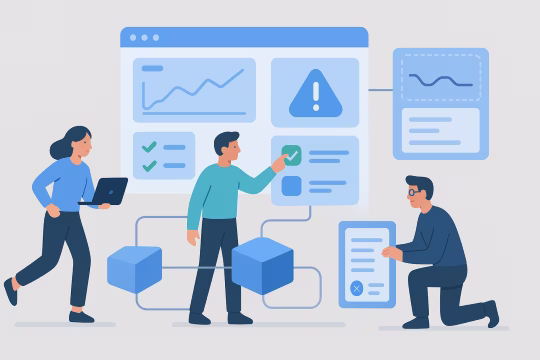
As headless platforms grow, delivery paths become longer and more variable: a single user interaction may traverse edge routing, frontend rendering, multiple APIs, and third-party dependencies. When telemetry is inconsistent or missing, teams rely on partial signals such as infrastructure CPU graphs or isolated application logs, which do not explain end-to-end user impact.
This lack of visibility creates architectural blind spots. Latency and error rates cannot be attributed to a specific service boundary, making it difficult to decide whether to scale, optimize code, adjust caching, or change integration patterns. Different teams often implement their own monitoring conventions, resulting in incompatible dashboards, duplicated alerts, and metrics that cannot be compared across environments.
Operationally, incidents take longer to diagnose and resolve because responders cannot correlate traces, logs, and metrics for the same request. Alerting becomes noisy and reactive, with thresholds tuned to symptoms rather than service objectives. Over time, this increases deployment risk, slows delivery due to cautious release practices, and makes reliability improvements hard to prioritize because impact cannot be measured consistently.
Review platform topology, critical user journeys, and operational pain points. Identify service boundaries, dependencies, and current telemetry gaps across APIs, edge components, and supporting services to define an observability baseline.
Define a consistent telemetry model for metrics, traces, and logs. Establish naming conventions, resource attributes, cardinality controls, and sampling strategies aligned with headless request flows and operational needs.
Implement or standardize instrumentation in services and gateways using OpenTelemetry SDKs and collectors. Capture spans, context propagation, and key business and technical attributes required for correlation and SLO measurement.
Design Prometheus metric sets, labels, and recording rules to support actionable dashboards and alerting. Focus on golden signals, saturation indicators, and service-specific metrics while controlling cost and cardinality.
Build Grafana dashboards that map to services and user journeys, including latency distributions, error budgets, dependency health, and deployment overlays. Provide consistent drill-down paths from symptoms to root-cause evidence.
Implement alert rules tied to SLOs and operational thresholds, with routing, deduplication, and severity. Create runbooks that link alerts to dashboards, traces, and remediation steps to reduce time-to-diagnosis.
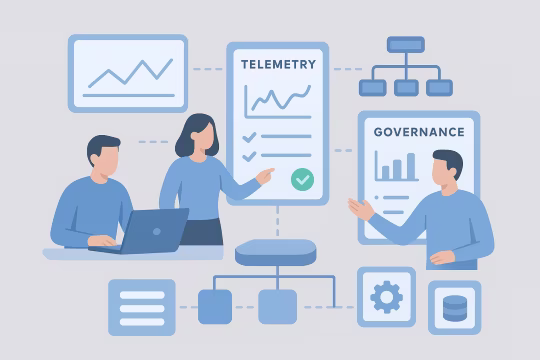
Establish ownership for signals, dashboards, and alerts, plus review cadences for SLOs and noise reduction. Iterate on instrumentation, sampling, and dashboards as services evolve and new dependencies are introduced.
This service establishes a consistent headless platform observability foundation for ecosystems where user journeys span multiple services and teams. It standardizes OpenTelemetry instrumentation, Prometheus metrics architecture, and Grafana service views so teams can correlate metrics, logs, and distributed tracing for microservices. The focus is on scalable telemetry conventions, reliable SLI/SLO error budgets, and operational practices that remain maintainable as platform complexity grows.
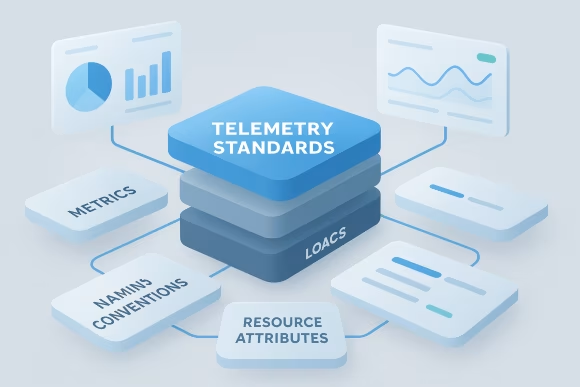
Define a platform-wide model for metrics, traces, and logs, including naming conventions, resource attributes, and label policies. This enables consistent dashboards and cross-service comparisons while controlling high-cardinality risks that can destabilize monitoring backends.
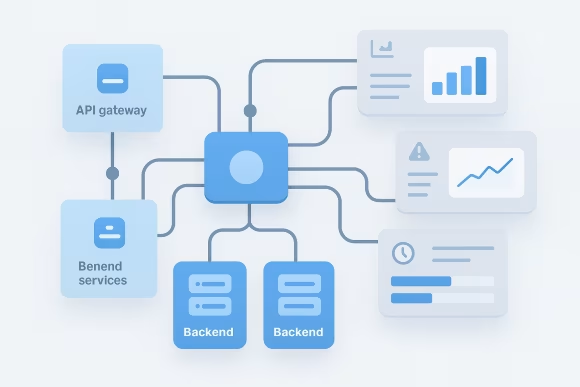
Implement end-to-end tracing across API gateways, backend services, and key dependencies with reliable context propagation. Traces are structured to reflect headless request paths, enabling responders to pinpoint latency contributors, error sources, and dependency bottlenecks.

Design SLIs that map to real platform behavior, such as request success rate, tail latency, saturation, and dependency availability. SLIs are derived from telemetry in a way that is stable across deployments and supports meaningful SLO reporting.
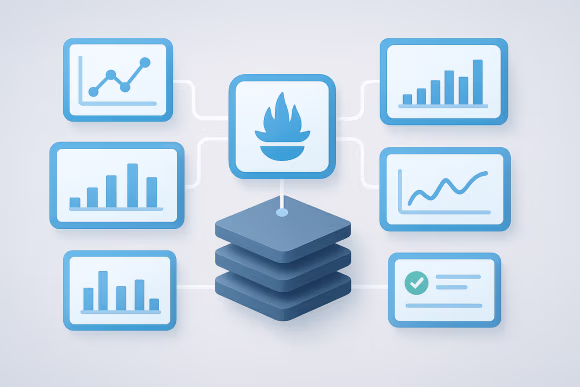
Create metric taxonomies, recording rules, and aggregation strategies that support both real-time operations and trend analysis. This includes histogram usage for latency, rate calculations for errors, and precomputed series for reliable alert evaluation.
Build service and journey dashboards with consistent navigation, drill-down paths, and deployment annotations. Dashboards connect high-level health views to detailed evidence, including trace exemplars and links to logs for the same request context.
Implement alert rules aligned to SLOs and operational thresholds, with severity definitions and deduplication strategies. Noise is reduced through multi-window burn-rate alerts, dependency-aware conditions, and clear ownership to prevent alert fatigue.

Standardize log context fields and correlation identifiers so responders can pivot from a trace span to the relevant logs quickly. This improves root-cause analysis for intermittent failures, integration errors, and edge-case request patterns.

Create runbook templates tied to alerts and dashboards, including verification steps, rollback guidance, and escalation paths. Runbooks are maintained as part of platform operations to keep incident response consistent as services and teams change.
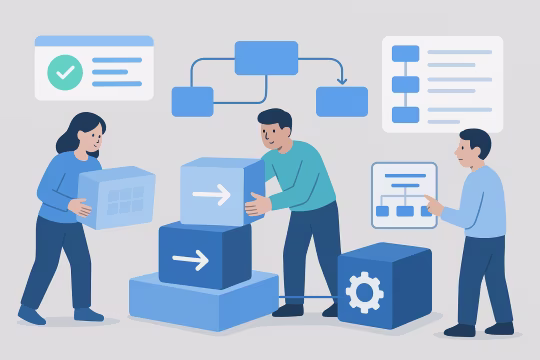
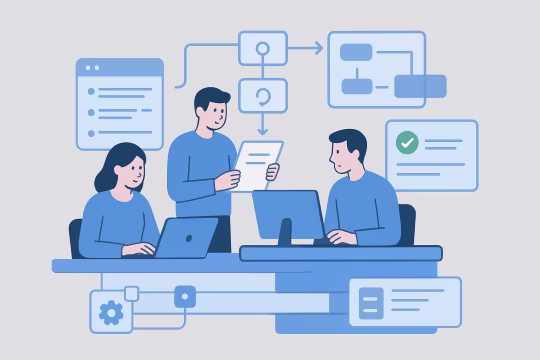
Delivery follows an engineering sequence from discovery through implementation and operationalization. We map headless request flows, define telemetry standards, implement OpenTelemetry instrumentation, and establish Prometheus Grafana API monitoring with dashboards, alerts, and SLI/SLO reporting. The engagement then iterates on coverage, noise reduction, and governance as services evolve.
[01]Map the headless architecture, critical journeys, and current monitoring coverage. Establish initial hypotheses for failure modes and define the minimal set of signals required for reliable operations.
 [02]
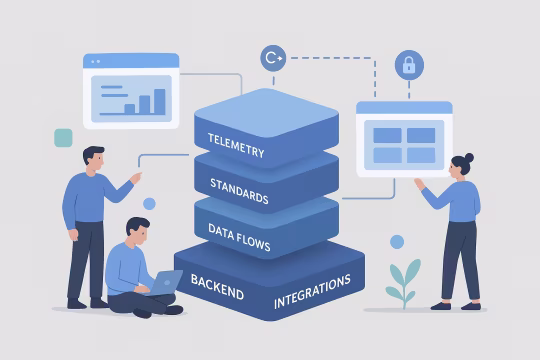
[02]Design telemetry standards, data flows, and backend integration patterns. Define SLI/SLO candidates, sampling and cardinality controls, and dashboard structures aligned with service ownership.
 [03]
[03]Implement OpenTelemetry instrumentation and collector configuration across priority services. Validate context propagation, span structure, and metric semantics in lower environments before expanding coverage.
 [04]
[04]Deliver Grafana dashboards and alert rules that reflect service health and user impact. Tune thresholds and burn-rate alerts using real traffic patterns and incident scenarios to reduce noise.
 [05]
[05]Create runbooks, on-call playbooks, and escalation paths linked directly from alerts and dashboards. Establish ownership for signals and define review cadences for SLOs and alert quality.
 [06]
[06]Run incident simulations and controlled failure tests to validate that telemetry supports diagnosis. Use findings to improve instrumentation, dashboards, and runbooks, and to close known observability gaps.
 [07]
[07]Iterate as services evolve, new dependencies are introduced, or traffic patterns change. Maintain telemetry standards and governance so observability remains consistent across teams and environments.
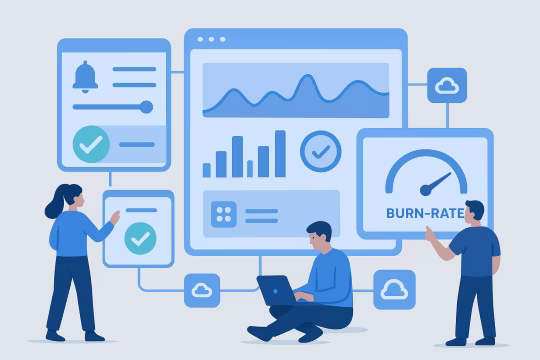
Headless platform observability reduces operational uncertainty by making API and service behavior measurable and comparable over time. With distributed tracing for microservices, Prometheus/Grafana service views, and log correlation, teams can diagnose incidents faster and validate release impact against SLI/SLO error budgets. This supports safer delivery, clearer reliability ownership, and more consistent platform operations across teams.
Correlated metrics, traces, and logs reduce time spent guessing where failures originate. Responders can identify the failing service boundary and dependency path quickly, improving mean time to diagnosis and resolution.
Release impact can be evaluated against SLIs and SLOs rather than subjective signals. This supports safer rollouts, clearer rollback criteria, and faster recovery when regressions occur.
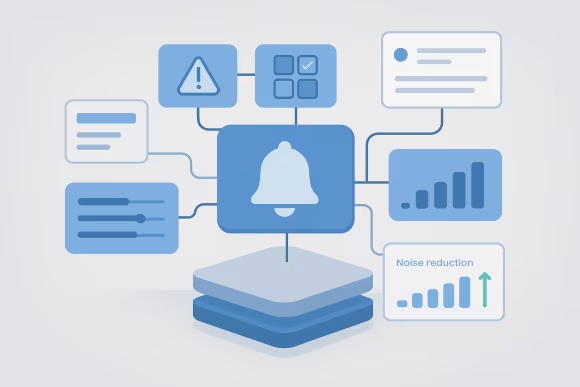
Alerting tied to service objectives and burn rates reduces false positives and duplicate paging. Teams spend less time reacting to symptoms and more time addressing root causes and reliability work.
SLO reporting and error budgets make reliability measurable and actionable across services. This enables consistent prioritization of stability improvements and prevents chronic issues from being normalized.
Service dashboards and SLOs aligned to ownership boundaries clarify who responds and what “healthy” means. Cross-team handoffs become evidence-based, reducing friction during incidents and post-incident reviews.
Metrics designed for saturation and throughput support capacity planning and scaling decisions. Teams can distinguish between code-level inefficiency, dependency constraints, and infrastructure limits.
Developers can reproduce and diagnose issues using traces and correlated logs without lengthy manual investigation. This reduces context switching during on-call and shortens feedback loops for performance and reliability fixes.
Adjacent services that extend headless platform operations, including API and composable architecture work, delivery governance, DevOps enablement, and performance optimization—often implemented alongside headless platform observability to improve reliability end to end.
Enterprise API design for scalable, secure foundations
API-first platform design with clear domain boundaries
Composable DXP content architecture and API-first platform design
API-first enterprise headless CMS platform architecture for content delivery
Structured schemas for an API-first content strategy
Contract-first headless API development for enterprise delivery
Headless CMS API integration, contracts, and integration layer engineering
Headless CMS CI/CD pipelines for decoupled web platforms
Reduce latency across rendering and APIs
Common questions about implementing and operating observability for headless architectures, including architecture, integration, governance, risk, and engagement.
We start from the platform topology and the user journeys that matter operationally: page render, search, authentication, checkout, content delivery, and API aggregation. From there we define service boundaries and the signals required to understand health at each boundary: request rate, errors, latency distributions, and saturation. The architecture is then expressed as a telemetry model (naming, attributes, label policies), a data flow (instrumentation to collectors to backends), and a set of service views (dashboards and alerts aligned to ownership). For headless systems, context propagation is a primary design concern because requests traverse gateways, edge layers, and multiple APIs. We standardize trace context propagation, define span semantics for key operations, and ensure metrics and logs share correlation identifiers. We also design for scale: sampling strategies for traces, cardinality controls for metrics, and retention policies that balance operational needs with cost. Finally, we align the architecture to operational governance: SLI/SLO definitions, alerting strategy, and runbook conventions so the system remains consistent as services and teams evolve.
Useful SLIs are those that reflect user impact and can be measured reliably from telemetry. For headless APIs, common SLIs include request success rate (2xx/3xx vs 4xx/5xx with careful classification), latency at meaningful percentiles (p95/p99), and saturation indicators such as queue depth, thread pool exhaustion, or upstream timeouts. For edge services and gateways, SLIs often include cache hit ratio, origin error rate, and tail latency for routed requests. SLOs should be set per service and per critical journey, not as a single platform-wide number. We typically define SLOs for availability and latency, then use error budgets to guide operational decisions. For example, if a service is burning budget quickly, releases may be slowed or additional safeguards introduced. We also ensure SLOs are implementable: the underlying metrics must be stable across deployments, label cardinality must be controlled, and the measurement window must match the operational reality (e.g., multi-window burn-rate alerts for paging, longer windows for reporting).
Alert fatigue is usually caused by symptom-based thresholds, duplicated alerts across layers, and missing context that forces responders to page multiple teams. We address this by designing alerting around service objectives and failure modes. Practically, that means using SLO-based burn-rate alerts for user-impacting issues, and reserving threshold alerts for clear saturation or imminent capacity problems. We also rationalize alert sources. For example, if an API gateway already measures end-to-end error rate, we avoid paging separately on every downstream service for the same incident unless ownership requires it. Alerts are grouped by service and severity, with clear routing and deduplication. Finally, we treat alert tuning as an operational process. We review noisy alerts, adjust evaluation windows, refine metric definitions, and improve runbooks so responders can validate and remediate quickly. The goal is fewer pages with higher signal quality, not more monitoring.
On-call readiness means the telemetry and operational artifacts are sufficient for a responder to diagnose and act without relying on undocumented knowledge. We validate this by ensuring each paged alert links to a service dashboard, which in turn provides drill-down to traces and correlated logs. The responder should be able to answer: what is broken, who owns it, what changed recently, and what the likely remediation options are. We also define runbook standards. A runbook should include verification steps, common causes, safe mitigations (feature flags, throttling, scaling, rollback), and escalation paths. For headless platforms, we pay special attention to dependency failures and third-party limits, because many incidents are caused by upstream timeouts, auth provider issues, or rate limiting. Where possible, we validate readiness through game days or incident simulations. These exercises reveal missing signals, unclear ownership boundaries, and dashboards that look good but do not support real diagnosis under time pressure.
We typically start with incremental instrumentation. Many services can adopt OpenTelemetry via auto-instrumentation (where available) or minimal middleware changes that add tracing and basic metrics around inbound requests, outbound HTTP calls, and database operations. The key is to standardize resource attributes (service name, environment, version) and ensure trace context propagation across service boundaries. We then add targeted manual spans for operations that matter in headless platforms, such as CMS fetches, personalization calls, search queries, and cache interactions. This provides meaningful trace structure without rewriting business logic. Collector configuration is also part of integration. We use the OpenTelemetry Collector to manage exporters, sampling, and attribute processing centrally, reducing per-service complexity. Integration is validated by following a single request end-to-end across the gateway and downstream services, confirming that traces, metrics exemplars, and logs share correlation identifiers.
We structure metrics around service ownership and operational questions. Each service exposes a small, consistent set of request metrics (rate, errors, latency histograms) plus service-specific saturation and dependency metrics. We standardize metric names and labels, and we explicitly control label cardinality to avoid runaway series counts, which can degrade Prometheus performance and increase cost. Recording rules are used to precompute common aggregations and to stabilize alert evaluation. For example, we record per-service error rates and latency percentiles over standard windows, then build dashboards and alerts on those recorded series. This improves query performance and reduces the risk of inconsistent calculations across dashboards. For headless platforms, we also model dependency metrics: upstream timeouts, retry rates, circuit breaker opens, and cache hit ratios. These metrics help distinguish between internal regressions and external dependency failures, which is critical for accurate incident response and for prioritizing reliability work.
We align observability artifacts to the same ownership model as the services themselves. Each service should have an owning team responsible for its dashboards, alerts, and SLOs, with a clear escalation path for shared components such as gateways, identity, and edge routing. Where ownership is unclear, we help define a practical model that matches how incidents are handled today and how the platform is expected to evolve. We also introduce conventions to keep artifacts consistent: dashboard templates, alert naming, severity definitions, and runbook structure. These conventions reduce cognitive load during incidents and make it easier for teams to adopt shared practices. Governance is implemented as lightweight processes: periodic SLO reviews, alert noise reviews, and instrumentation change control (especially for label cardinality and sampling). The goal is to prevent drift as new services are added, while keeping teams autonomous in how they operate their components.
We define a telemetry contract that covers naming conventions, required resource attributes, allowed labels, and span semantics for common operations. For example, every service should emit consistent request metrics and include attributes such as environment, service version, and deployment identifier. For traces, we define span naming patterns and required attributes for key integrations so cross-service traces remain readable. We also implement guardrails. In Prometheus, that includes label policy guidance and reviews to prevent high-cardinality labels from being introduced accidentally. In OpenTelemetry, we use collector processors to normalize attributes, drop unsafe fields, and apply sampling policies consistently. To keep standards alive, we recommend treating observability configuration as code with review workflows. Dashboards, alert rules, and collector configs should be versioned, tested where feasible, and deployed through the same CI/CD discipline as application changes. This reduces drift and makes changes auditable.
The most common risk is uncontrolled telemetry volume, especially metric label cardinality and trace/log verbosity. High-cardinality labels (user IDs, request IDs, full URLs) can create excessive time series and destabilize monitoring systems. We mitigate this by defining label policies, using normalized route templates, and reviewing instrumentation changes. For tracing, we apply sampling strategies and ensure spans carry useful attributes without capturing sensitive or overly verbose data. Another risk is building dashboards that look comprehensive but do not support diagnosis. We mitigate this by validating observability against real incident scenarios and by ensuring drill-down paths exist from alerts to service views to traces and logs. A third risk is fragmented ownership, where no team maintains alerts and dashboards. We mitigate this by aligning artifacts to service ownership, establishing review cadences, and keeping the system operable through templates and standards rather than bespoke per-team implementations.
We treat telemetry as production data that can contain sensitive information if not controlled. The first step is defining what must never be captured: credentials, tokens, personal data, and raw request/response bodies unless explicitly required and approved. Instrumentation is configured to avoid these fields, and collector processors can be used to redact or drop attributes that violate policy. We also recommend separating operational identifiers from personal identifiers. For example, use stable, non-PII correlation IDs and service-level attributes rather than user-level labels. Where user context is needed for debugging, we use hashed or scoped identifiers with clear retention and access controls. Finally, we align telemetry retention and access to enterprise security requirements. This includes role-based access to dashboards, auditability of configuration changes, and environment separation. Security reviews are integrated into the observability rollout so teams can adopt the capability without introducing compliance risk.
A typical engagement starts with discovery and a baseline implementation for a small set of critical services, then expands coverage iteratively. In early phases, we focus on the highest-value request paths: gateway/edge, primary APIs, and the most failure-prone dependencies. The goal is to make the platform diagnosable quickly, not to instrument everything at once. From there, we add depth: service dashboards, SLO reporting, alert tuning, and runbooks. We also standardize instrumentation patterns so additional services can be onboarded by internal teams with minimal friction. The timeline depends on platform size and existing telemetry, but the work is usually structured in short iterations with measurable checkpoints: end-to-end trace coverage for a journey, a service dashboard set, and a stable paging policy. We deliver configurations and code as reusable assets (templates, libraries, collector configs) so the organization can scale observability across teams without repeating design work.
Collaboration usually begins with a short discovery phase focused on architecture and operational reality. We run working sessions with SRE/DevOps and platform engineering to map the headless topology, identify critical user journeys, review recent incidents, and assess current telemetry coverage. We also confirm constraints such as data retention, security requirements, and existing tooling standards. Based on that, we propose a prioritized backlog: which services to instrument first, which dashboards and alerts are required for on-call readiness, and what SLI/SLO definitions are feasible with available signals. We agree on ownership boundaries and delivery mechanics, including how changes will be reviewed and deployed (observability-as-code, CI/CD, and environment promotion). The first implementation iteration typically targets one end-to-end journey and a small set of services, proving trace propagation, metric semantics, and alert usefulness. This creates a repeatable pattern for scaling observability across the rest of the platform.
These case studies showcase practical implementations of observability, performance monitoring, and operational governance within complex digital platforms. They highlight the use of telemetry standards, distributed tracing, and metrics architectures to improve reliability, incident response, and scalable platform delivery. Each example demonstrates measurable improvements in monitoring, alerting, and operational workflows aligned with headless and distributed service architectures.
UNCCD operated four separate websites (two WordPress, two Drupal), leading to inconsistencies in design, content management, and user experience. A unified, scalable solution was needed to support a large-scale CMS migration project and improve efficiency and usability.
The modernization effort resulted in a cohesive, user-friendly, and scalable website, improving content management efficiency and long-term digital sustainability.
With Drupal 7 reaching end-of-life, Veolia needed a Drupal 7 to Drupal 10 enterprise migration for its Acquia Site Factory multisite platform—preserving region-specific content and multilingual capabilities across more than 200 sites.
The platform was modernized into a stable, scalable multisite foundation with improved performance, maintainability, and long-term upgrade readiness.
LSHTM required improvements to its existing higher education Drupal platform to better manage and distribute complex research data, including support for third-party integrations, Drupal performance optimization, and more reliable synchronization.
The solution improved data accessibility, streamlined research workflows, and enhanced system performance, enabling LSHTM to manage complex datasets more efficiently.
It was my pleasure working with Oleksiy (PathToProject) on a new Drupal website. He is a true full-stack developer—the ideal mix of DevOps expertise, deep front-end knowledge, and the structured thinking of a senior back-end developer.
He is well-organized and never lets anything slip. Oleksiy understands what needs to be done before being asked and can manage a project independently with minimal involvement from clients, product managers, or business analysts.
One of the best consultants I’ve worked with so far.

Andrei Melis
Technical Lead at Eau de Web
Oleksiy (PathToProject) worked with me on a specific project over a period of three months. He took full ownership of the project and successfully led it to completion with minimal initial information.
His technical skills are unquestionably top-tier, and working with him was a pleasure. I would gladly collaborate with Oleksiy again at any opportunity.

Nikolaj Stockholm Nielsen
Strategic Hands-On CTO | E-Commerce Growth
As Dev Team Lead on my project for 10 months, Oleksiy (PathToProject) demonstrated excellent technical skills and the ability to handle complex Drupal projects. His full-stack expertise is highly valuable.

Laurent Poinsignon
Domain Delivery Manager Web at TotalEnergies
These articles expand on the operational and architectural concerns behind observability in headless platforms. They cover what to instrument, how to measure publishing reliability, and how dependency visibility and rollback behavior affect incident response and service governance.
Let’s review your headless architecture, identify telemetry gaps, and establish SLOs, dashboards, and alerting that support predictable operations.