


 [01]
[01]Discovery Workshop
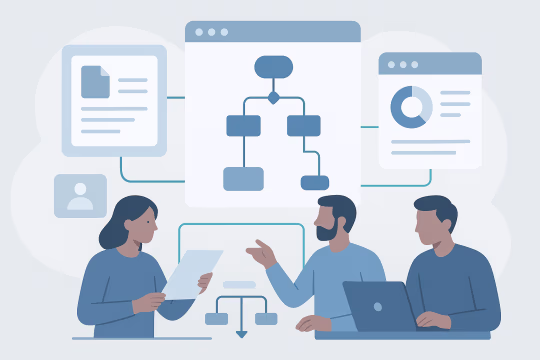
Align on platform topology, reliability goals, and operational constraints. Inventory current monitoring, logging, and incident patterns, then define initial SLIs, alerting principles, and access requirements.
Drupal operations readiness
Use a Drupal health check to review observability coverage, alert quality, upgrade readiness, and governance around logs, metrics, and response workflows before issues escalate.
Built to surface operational blind spots before roadmap or support commitments.
No login required. Takes 2–3 minutes.
Drupal platforms often fail operationally not because of missing features, but because teams lack reliable signals about performance, errors, and capacity. Drupal monitoring services and Drupal observability engineering establish a measurable view of platform health across application, infrastructure, and dependencies, so incidents can be detected early and diagnosed quickly.
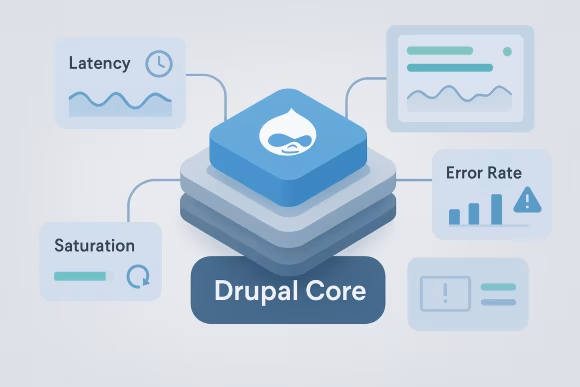
This capability connects Drupal runtime telemetry with actionable dashboards and alerting. It typically includes service-level indicators (latency, error rate, saturation), Drupal and PHP-FPM signals, database and cache health, queue/backlog visibility, and centralized logging for request correlation. Where appropriate, tracing and structured logging are introduced to reduce time spent reproducing production-only failures.
For enterprise platforms, observability is also an architectural concern: signals must be consistent across environments, resilient to deployment changes, and governed to avoid alert fatigue. A well-designed observability layer supports scalable operations by enabling capacity planning, release validation, incident response workflows, and continuous reliability improvement without coupling teams to a single engineer or tribal knowledge.
Core Focus
Best Fit For
Key Outcomes
Technology Ecosystem
Operational Scope
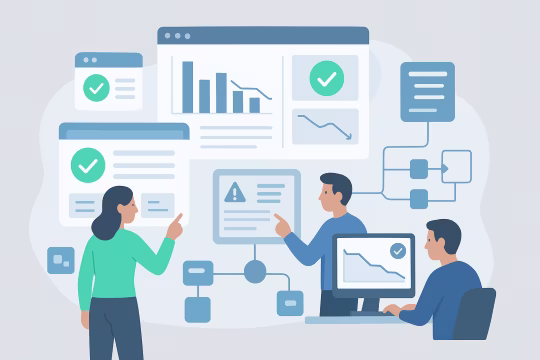
As Drupal platforms grow, operational complexity increases across application code, PHP runtime, caches, databases, search, and external APIs. Without consistent monitoring, teams rely on user reports, ad-hoc log access, or infrastructure-level checks that do not reflect real service health. This creates blind spots where performance regressions, slow queries, cache stampedes, and background queue failures accumulate until they become outages.
Engineering teams then spend disproportionate time assembling context during incidents: which deployment introduced the change, whether the issue is localized to a tenant, which dependency is failing, and whether the platform is approaching capacity limits. When logs are fragmented and metrics are not tied to service-level indicators, diagnosis becomes a manual process of correlating timestamps across systems. Alerting often becomes either too quiet (missed incidents) or too noisy (alert fatigue), both of which reduce trust in operational tooling.
Operationally, these gaps slow delivery and increase risk. Releases are harder to validate, performance work becomes speculative, and platform teams cannot quantify reliability or prioritize improvements. Over time, the platform becomes harder to operate predictably, especially across multiple environments and teams with shared ownership.
Review the Drupal architecture, runtime topology, and operational goals. Identify critical user journeys, dependencies, and failure modes, then define initial SLIs, alert thresholds, and the minimum viable telemetry needed for incident response.
Design the observability stack and data flows for metrics and logs, including retention, cardinality controls, and access boundaries. Define naming conventions, labels, and environment strategy so signals remain comparable across dev, staging, and production.
Implement and configure Prometheus scraping and exporters for infrastructure and application-adjacent components. Add Drupal/PHP-FPM, web server, database, cache, and queue metrics, and map them to service health indicators rather than host-only utilization.
Establish centralized logging with parsing, normalization, and correlation fields. Configure log shipping from containers and hosts, define index patterns and retention, and ensure sensitive data handling aligns with security and compliance requirements.
Build Grafana dashboards for service health, dependency health, and operational drill-down. Provide role-specific views for on-call responders, platform engineers, and product stakeholders, including release markers and environment comparisons.
Create alert rules based on SLIs and symptom-based signals, then tune for actionable paging. Configure routing, deduplication, and escalation paths, and validate alerts through controlled failure scenarios and load tests where feasible.
Document runbooks that connect alerts to diagnostics, mitigations, and ownership. Establish review routines for alert quality, dashboard relevance, and SLO reporting, and define change control for observability configuration.
Use incident learnings and trend analysis to refine signals, reduce noise, and improve coverage. Introduce additional instrumentation, tracing, or synthetic checks as the platform evolves and new dependencies are added.
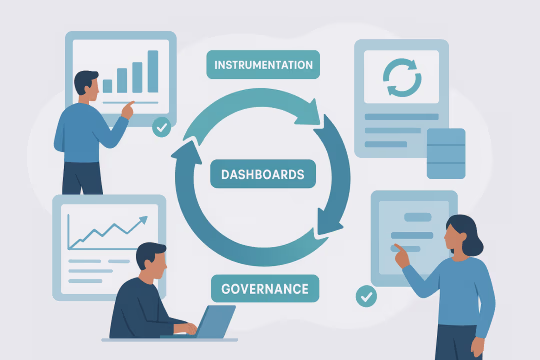
This service establishes a coherent observability layer for Drupal production systems by combining service-level metrics, centralized logs, and actionable alerting. Prometheus and Grafana for Drupal platforms are used to make signals visible and operationally useful, not just infrastructure utilization. Implementations emphasize consistent naming, controlled metric cardinality, and environment parity so dashboards and alerts remain stable as the platform evolves. The result is a maintainable model that supports on-call readiness, release validation, and Drupal observability and SLOs engineering.
Define SLIs that reflect real service health, such as request latency, error rate, and saturation, and map them to Drupal entry points and critical journeys. Implement measurement that is stable across deployments and environments, enabling SLO reporting and meaningful alert thresholds tied to user impact.

Instrument the Drupal runtime by capturing PHP-FPM, web server, and application-adjacent signals that explain performance and failure modes. This includes worker utilization, slow request patterns, cache behavior, and queue/backlog indicators so responders can distinguish capacity issues from functional defects.

Monitor the components Drupal depends on, including databases, caches, search, and external APIs, using metrics that expose latency, errors, and resource contention. Correlate dependency signals with service health to speed root-cause isolation and prevent misattribution to application code.

Implement centralized logging with consistent fields for environment, service, request identifiers, and deployment metadata. Normalize and parse logs to support fast filtering and correlation, enabling responders to pivot from an alert to the relevant logs without manual cross-system searching.

Create alert rules that prioritize symptoms and user impact, with clear thresholds, runbook links, and ownership. Reduce noise through deduplication, sensible evaluation windows, and separation of paging alerts from informational notifications, improving on-call effectiveness and trust in alerts.
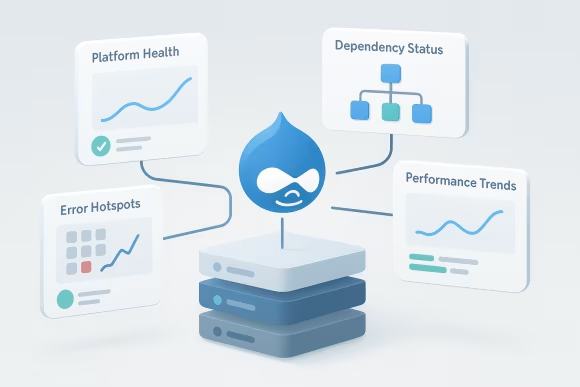
Build dashboards that support both high-level health checks and deep diagnostic workflows. Provide views for platform health, dependency status, error hotspots, and performance trends, including release annotations to connect changes in telemetry to deployments and configuration updates.

Establish SLO reporting that turns telemetry into operational governance, including error budgets and reliability trends. Support regular reviews to prioritize reliability work, validate alert quality, and align platform operations with product expectations and risk tolerance.
Identify where weak telemetry, noisy alerting, and fragmented ownership create avoidable incident pressure and slow recovery.
Engagements follow a clear engineering sequence from discovery through implementation and long-term evolution. We establish a minimum viable baseline for enterprise Drupal SRE and production monitoring, then iterate toward deeper coverage, alert tuning, and governance. Work is delivered as infrastructure-as-code and configuration where possible, with operational handover and documentation for on-call teams.
[01]Align on platform topology, reliability goals, and operational constraints. Inventory current monitoring, logging, and incident patterns, then define initial SLIs, alerting principles, and access requirements.
 [02]
[02]Design the target observability architecture, including data flows, retention, and security boundaries. Define conventions for metric names, labels, log fields, and environment strategy to keep signals consistent over time.
 [03]
[03]Deploy or configure the core stack components and integrate key exporters and log shippers. Establish a first set of dashboards and alerts focused on service health and the most common incident drivers.
 [04]
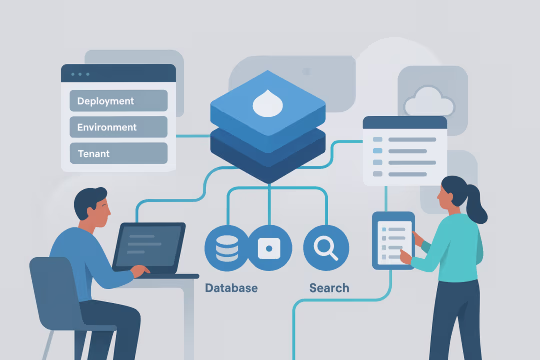
[04]Extend telemetry to Drupal runtime behavior and critical dependencies such as database, cache, and search. Add correlation metadata (deployment, environment, tenant) so responders can isolate issues quickly.
 [05]
[05]Tune alerts to reduce noise and improve actionability, then validate through controlled tests and review of historical incidents. Ensure alert messages include context, ownership, and runbook references.
 [06]
[06]Deliver runbooks, dashboard guides, and on-call workflows, including escalation paths and access patterns. Provide knowledge transfer sessions and define a process for ongoing changes to observability configuration.
 [07]
[07]Run periodic reviews of SLOs, alert performance, and incident learnings. Iterate on instrumentation, dashboards, and governance as the Drupal platform and its dependencies evolve.
Drupal monitoring and observability reduce operational uncertainty by turning platform behavior into measurable signals that teams can act on. The impact is realized through faster diagnosis and MTTR reduction, safer releases, and more predictable capacity and reliability planning—supported by Drupal SRE practices and consistent SLI/SLO reporting.
Centralized signals shorten the time from detection to diagnosis by providing immediate context. Responders can correlate service health, dependency metrics, and logs without manual data gathering across tools.
Trend visibility highlights recurring failure modes such as resource saturation, slow queries, or cache instability. Teams can prioritize preventative work based on evidence rather than anecdote.
Release annotations and health dashboards make regressions visible quickly after deployment. This supports faster rollback decisions and reduces the risk of prolonged partial outages.
Actionable alerts and runbooks reduce alert fatigue and improve consistency across responders. New team members can operate the platform with less reliance on tribal knowledge.
Saturation and performance trends provide a basis for scaling decisions and cost forecasting. Teams can distinguish between transient spikes and sustained growth that requires architectural changes.
SLIs and SLOs create a shared language for reliability across engineering and product stakeholders. This supports prioritization, error budget discussions, and transparent reporting on platform health.
Better visibility into dependencies and failure modes reduces the likelihood of undetected degradation. Clear escalation paths and validated alerting improve response during high-severity incidents.
Before you commit to changes
Confirm whether your Drupal estate has the monitoring, governance, and integration visibility needed to support upgrades, incident response, and operational scale.
Adjacent operational capabilities that commonly extend monitoring and observability work across Drupal platform delivery and support.
Designing Scalable Digital Foundations
Drupal content architecture design and editorial operating design
Entity modeling and durable data structures
Drupal editorial workflow engineering and permissions model design
Headless Drupal Development Services for API-First Front-Ends
One Platform. Multiple Brands. Infinite Scalability.
Scalable indexing and relevance design
Automated CI/CD Pipelines. Reliable Infrastructure.
Kubernetes Drupal infrastructure design for Drupal workloads
Common questions from platform and reliability teams evaluating monitoring and observability for Drupal production systems.
We start from user-impacting behaviors rather than host utilization. For Drupal, common SLIs include request success rate (HTTP 5xx and application-level failures), latency for key endpoints (homepage, search, checkout, authenticated flows), and saturation indicators (PHP-FPM worker exhaustion, database connection pressure, cache hit ratio degradation). We then translate those SLIs into SLOs that match business tolerance and operational reality. For example, an availability SLO might be paired with a latency SLO for critical journeys, plus a background-processing SLO for queues if the platform relies on asynchronous work. We also define error budget policies: what constitutes a burn rate, when to page, and when to trigger reliability work. Finally, we ensure the measurement is stable: consistent labels, controlled cardinality, and comparable environments. SLOs only work when the underlying telemetry is trustworthy and not overly sensitive to deployment changes, traffic anomalies, or noisy metrics.
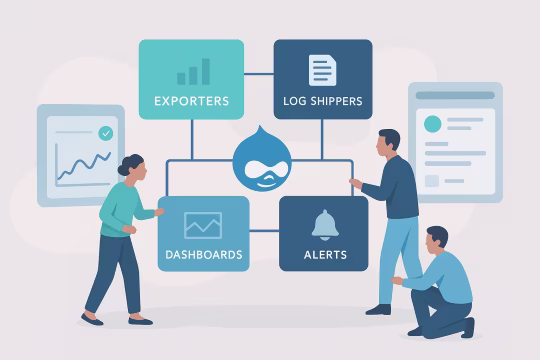
A typical architecture separates concerns across metrics, logs, and alerting. Prometheus (or a compatible metrics backend) scrapes exporters for infrastructure and services, while Grafana provides dashboards and alert evaluation. Centralized logging is handled via an ELK pipeline, with log shipping from Docker hosts/containers and parsing rules that normalize fields. For Drupal, we usually monitor at multiple layers: edge/web (Nginx/Apache), PHP-FPM, Drupal application behavior (errors, cache behavior, queue depth), and dependencies (database, cache, search, external APIs). We add correlation metadata such as environment, service, tenant/site, and deployment version so responders can pivot from an alert to the relevant logs and metrics. The architecture also includes governance: retention policies, access controls, and conventions for naming and labels. This prevents metric explosions, keeps dashboards maintainable, and ensures observability remains reliable as the platform scales and teams change.
We design alerts around symptoms and user impact, not every possible metric threshold. The first layer is SLI-based paging: alerts tied to error rate, latency, and saturation with burn-rate logic where appropriate. The second layer is diagnostic alerts that provide context but do not page, such as increasing slow queries or cache eviction spikes. We also tune evaluation windows and grouping to avoid flapping and duplicate pages. Alerts should include clear ownership, a concise description of impact, and a direct link to the relevant dashboard and runbook. If an alert cannot be acted on, it should not page. After implementation, we run an alert review cycle. We look at false positives, missed incidents, and noisy rules, then adjust thresholds, add missing signals, or refine routing. Alerting quality is treated as an operational asset that requires ongoing maintenance, not a one-time configuration task.
We recommend a small set of repeatable practices: a clear on-call rotation with escalation paths, runbooks tied to alerts, and a consistent incident process (severity classification, communication, and post-incident review). Observability should support these practices by providing a single place to answer: what is broken, what changed, and what to do next. For Drupal specifically, runbooks often cover PHP-FPM saturation, cache instability, database contention, queue backlogs, and dependency failures. Dashboards should include a top-level service health view, plus drill-down panels that map to those runbooks. We also encourage regular reliability reviews using SLO reports and incident trends. This helps teams prioritize reliability work, validate that alerts remain actionable, and ensure operational knowledge is shared across platform and application teams rather than concentrated in a few individuals.
Effective integration starts with consistent structure. We configure log shipping from Docker (or hosts) into Logstash/Elasticsearch, then normalize fields such as timestamp, environment, service, hostname/container, and request identifiers. Where possible, we parse web server access logs and PHP/Drupal logs into structured fields so Kibana queries are reliable and fast. We also address sensitive data and compliance. Drupal logs can inadvertently include user identifiers, tokens, or request payloads; we implement filtering and redaction rules and set retention policies appropriate to the organization’s requirements. Finally, we connect logs to operational workflows. Dashboards and alerts should link to pre-filtered Kibana views, and logs should include deployment metadata (version, build, git SHA) to correlate incidents with releases. The goal is to reduce time spent searching and increase time spent diagnosing with relevant context.
We collect a layered set of metrics. At the infrastructure level: CPU, memory, disk, network, and container runtime signals. At the web/runtime level: request rates, response codes, upstream latency, and PHP-FPM pool metrics such as active/idle workers, queue length, and slow request indicators. For dependencies, we collect database metrics (connections, query latency proxies, locks, buffer/cache behavior where available), cache metrics (hit ratio, evictions, memory pressure), and queue metrics (depth, processing rate, age of oldest message). If search is involved, we monitor indexing and query latency and error rates. We then map these metrics to dashboards and alerts that answer operational questions: is the service healthy, which dependency is driving degradation, and is the platform approaching saturation. We also control label cardinality to keep Prometheus stable and cost-effective at enterprise scale.
We design access around roles and operational needs. Platform and SRE teams typically require full access to dashboards, alert configuration, and log queries. Application teams may need read access to service dashboards and scoped log views. Stakeholders often need high-level SLO reporting without access to raw logs. We implement separation using the capabilities of the chosen stack (Grafana organizations/folders and permissions, Elasticsearch/Kibana roles and index permissions, and network-level controls). We also define what data is allowed to be collected and stored, including redaction rules and retention policies. Governance includes change control for alert rules and dashboards. We recommend versioning configuration as code where feasible, using review workflows to prevent accidental changes that create noise or blind spots. This keeps observability reliable and auditable over time.
Maintainability comes from standards and reuse. We define naming conventions, label schemas, and dashboard templates that can be applied across sites, environments, and clusters. For multi-site Drupal, we avoid per-site bespoke dashboards where possible and instead use variables and consistent labels to slice by tenant or site. We also control metric cardinality and log volume. Unbounded labels (like full URLs or user IDs) can destabilize metrics backends; we design aggregation strategies and sampling where appropriate. For logs, we define retention and indexing strategies that balance diagnostic value with cost. Operationally, we recommend a review cadence: quarterly dashboard relevance checks, alert quality reviews after incidents, and SLO recalibration when platform behavior changes. Observability is treated as part of the platform architecture, evolving alongside Drupal upgrades, infrastructure changes, and new integrations.
It can if implemented without constraints, but it is manageable with careful design. We prioritize low-overhead telemetry first: infrastructure and runtime metrics, web server metrics, and structured logging with controlled verbosity. For application-level instrumentation, we avoid high-cardinality labels and excessive per-request computation. Logging is often the bigger risk than metrics. We set log levels intentionally, filter noisy categories, and ensure that production logging does not include large payloads or sensitive data. Retention and indexing policies are tuned to avoid runaway storage and query costs. If tracing is introduced, we typically start with sampling and targeted instrumentation for critical paths. We validate overhead through load testing or by comparing baseline performance before and after changes. The goal is to improve operational visibility without creating new bottlenecks or destabilizing the platform.
We treat observability data as production data. For logs, we implement controls to prevent collection of secrets, tokens, and personal data. This includes redaction rules, careful selection of logged fields, and validation of Drupal and web server logging configuration. We also define retention periods aligned with compliance requirements. For metrics, we avoid labels that could contain personal data or identifiers. Metrics should describe system behavior, not user-level details. We also secure access to dashboards and log search using role-based permissions and network controls. Where organizations have strict requirements, we document data flows and storage locations, and we can support audit needs by versioning observability configuration and maintaining change history. The objective is to provide operational visibility while reducing the risk of data exposure through telemetry systems.
Timelines depend on platform complexity and what already exists. A minimum viable baseline for a single Drupal production environment can often be established in a few weeks: core metrics, a service health dashboard, basic alerting, and centralized logging with essential parsing. For multi-site estates, multiple environments, or strict governance requirements, implementation typically becomes iterative. Additional time is needed for dependency coverage, alert tuning, SLO reporting, access control, and runbook development. Alert quality usually improves after observing real traffic and incidents, so we plan for a tuning phase rather than treating alerting as a one-off task. We recommend delivering in increments: baseline visibility first, then deeper instrumentation and governance. This approach reduces risk, provides immediate operational value, and ensures the resulting observability layer remains maintainable as the Drupal platform evolves.
Deliverables typically include configured metrics collection, dashboards, alert rules, and centralized logging pipelines, plus documentation that explains how to use and maintain them. We also provide runbooks tied to paging alerts and a clear mapping of signals to ownership (platform, application, or dependency teams). Where possible, we implement configuration as code so your teams can review changes, version them, and deploy updates through your existing workflows. We also document conventions for naming, labels, and dashboard structure to keep future additions consistent. Handover includes working sessions with on-call responders and platform engineers: how to interpret service health, how to drill down during incidents, how to tune alerts safely, and how to extend coverage when new services or dependencies are introduced. The goal is operational independence with a maintainable baseline.
Collaboration typically begins with a short discovery phase focused on your current operational reality. We review the Drupal architecture, hosting model, environments, existing monitoring/logging tools, and recent incidents. We also identify the critical user journeys and dependencies that most often drive downtime or degraded performance. From that, we agree on a scoped baseline: which SLIs to implement first, what “actionable” means for your on-call model, and how access and data retention should work. We define success criteria such as reduced time to detect, reduced time to diagnose, and a first set of dashboards and alerts that responders will actually use. We then move into implementation in small increments, validating signals with real traffic and tuning alerts with your team. Early working sessions are hands-on and operational: we build the initial dashboards and runbooks together, so ownership and maintainability are established from the start rather than deferred to the end of the project.
These case studies highlight real-world implementations of Drupal platform stability, performance optimization, and observability engineering. They showcase measurable improvements in monitoring, alerting, and operational governance that align closely with Drupal SRE practices and enterprise-scale reliability goals. The selected work demonstrates practical delivery of metrics, dashboards, and incident response workflows essential for maintaining robust Drupal production systems.
LSHTM required improvements to its existing higher education Drupal platform to better manage and distribute complex research data, including support for third-party integrations, Drupal performance optimization, and more reliable synchronization.
The solution improved data accessibility, streamlined research workflows, and enhanced system performance, enabling LSHTM to manage complex datasets more efficiently.
The Deprexis mental health digital platform on Drupal required stabilization, faster performance, and a secure ecommerce payment workflow to support online services. The solution needed to meet strict reliability and security expectations common for digital healthcare products.
The platform was stabilized, performance was improved, and secure checkout workflows were delivered with strong automated coverage to reduce operational and compliance risks.
With Drupal 7 reaching end-of-life, Veolia needed a Drupal 7 to Drupal 10 enterprise migration for its Acquia Site Factory multisite platform—preserving region-specific content and multilingual capabilities across more than 200 sites.
The platform was modernized into a stable, scalable multisite foundation with improved performance, maintainability, and long-term upgrade readiness.
It was my pleasure working with Oleksiy (PathToProject) on a new Drupal website. He is a true full-stack developer—the ideal mix of DevOps expertise, deep front-end knowledge, and the structured thinking of a senior back-end developer.
He is well-organized and never lets anything slip. Oleksiy understands what needs to be done before being asked and can manage a project independently with minimal involvement from clients, product managers, or business analysts.
One of the best consultants I’ve worked with so far.

Andrei Melis
Technical Lead at Eau de Web
Oleksiy (PathToProject) and I worked together on a Digital Transformation project for Bayer LATAM Radiología. Oly was the Drupal developer, and I was the business lead. His professionalism, technical expertise, and ability to deliver functional improvements were some of the key attributes he brought to the project.
I also want to highlight his collaboration and flexibility—throughout the entire journey, Oleksiy exceeded my expectations.
It’s great when you can partner with vendors you trust, and who go the extra mile.

Axel Gleizerman Copello
Building in the MedTech Space | Antler
Oleksiy (PathToProject) is demanding and responsive. Comfortable with an Agile approach and strong technical skills, I appreciate the way he challenges stories and features to clarify specifications before and during sprints.

Olivier Ritlewski
Ingénieur Logiciel chez EPAM Systems
These articles expand on the operational patterns that shape a strong Drupal observability practice. They cover recovery planning, queue backpressure, and release or configuration governance that influence how well teams can detect issues, diagnose incidents, and keep production stable.
Let’s review your current monitoring and incident patterns, define SLIs/SLOs, and implement an observability baseline your on-call team can operate and evolve.